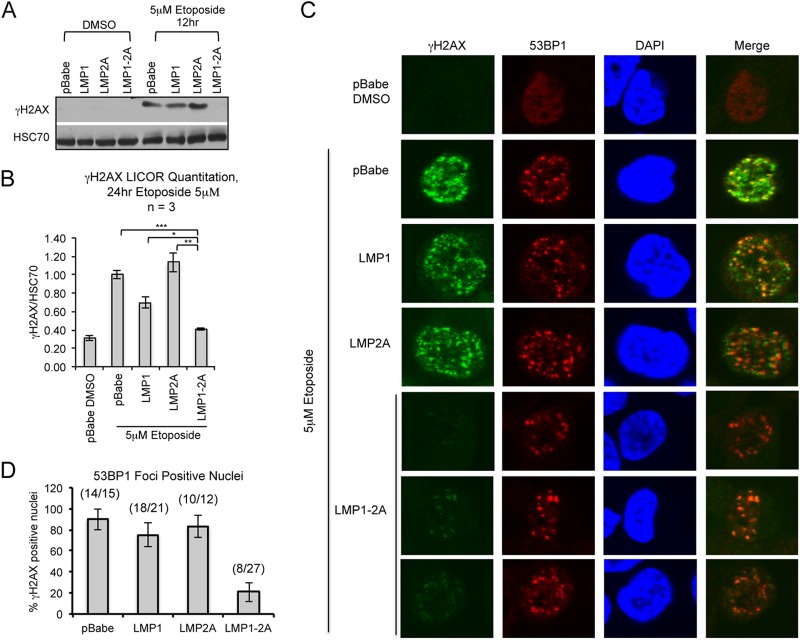
FIG 4.
LMP1 and LMP2A expression reduces γH2AX phosphorylation. Immunoblotting of γH2AX levels in HK1 cell lines treated with 5 μM etoposide for 12 (A) or 24 h (B). Changes in γH2AX levels were normalized to those for HSC70 and averaged from 3 independent treatments (n = 3). Quantitation of γH2AX levels was determined by LI-COR infrared imaging. Statistical significance was determined by an unpaired 2-tailed t test (*, P = 0.05; **, P = 0.01; ***, P = 0.001). (C) Immunofluorescence analysis of proteins associated with DNA damage foci in the nucleus of HK1 cell lines treated with 5 μM etoposide for 12 h and sampled at time intervals to identify 53BP1-positive cells. Cells were stained for γH2AX (S139) and 53BP1 and imaged by Olympus FV2000 confocal microscopy. Merged images were generated using Olympus Fluoview 3.0 software. (D) The number of 53BP1-positive nuclei was counted for all time points and analyzed for corresponding γH2AX focus staining, represented as a percentage of nuclei doubly positive for 53BP1 and γH2AX out of the total number of 53BP1-positive nuclei per field of view. Standard errors of the means (SEM) were calculated from 5 representative fields of view per image. A cumulative ratio of total γH2AX-positive nuclei to total number of 53BP1-positive nuclei is indicated above each column.

