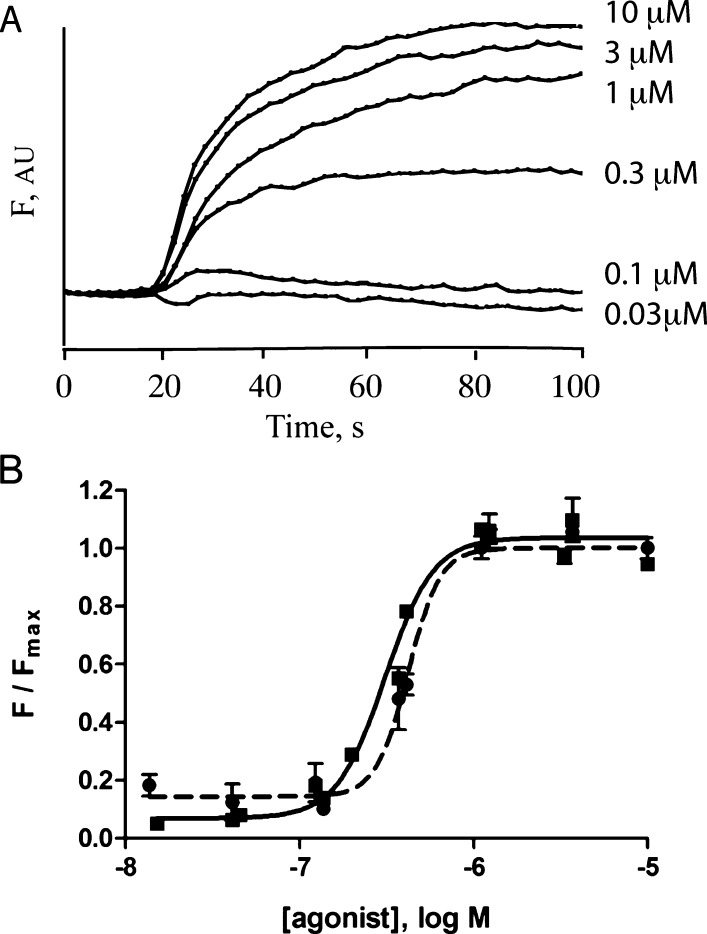
Figure 2.
HEK cell data. (A) Typical traces from HEK cells transfected with WT 5-HT3 receptor cDNA, loaded with membrane potential dye, and stimulated at 20 s with various concentrations of varenicline. F = arbitrary fluorescent units. (B) Concentration–response curves constructed from FlexStation responses to 5-HT (squares, filled line) and varenicline (circles, dashed line). Data = mean ± SEM, n = 4.

