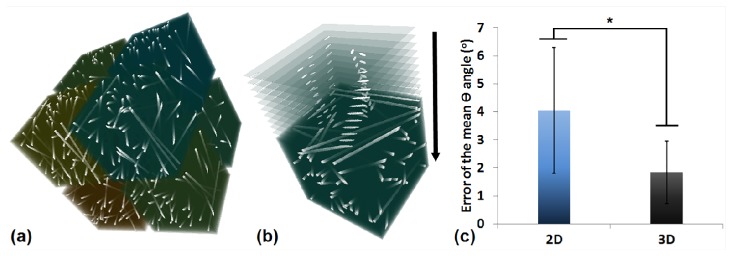
Fig. 10.

A comparison between 2D and 3D techniques. (a) 3D reconstruction of the 8 test stacks. (b) Schematic of the frame-by-frame manner of 2D analysis. Only the top 10 frames are zoomed in here for illustration. (c) Histograms showing the error of the mean determination. *, significant difference.
