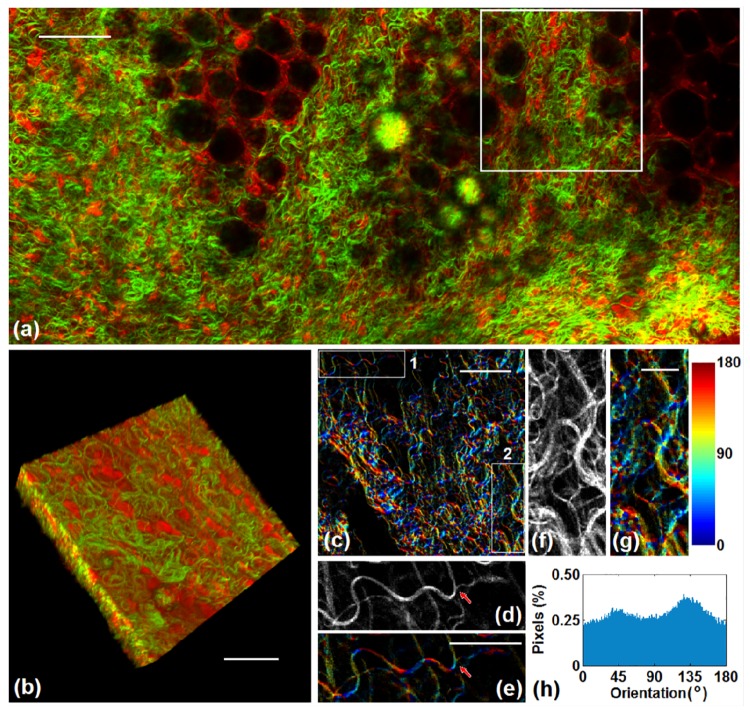
Fig. 11.
Orientation analysis of fibers from the mammary gland sample. (a) Combined fluorescence (red) and SHG (green) image. Scale bar: 100 μm. (b) The 3D stack of the marked region in (a). Scale bar: 50 μm. (c) One frame of the orientation map from the 3D stack, calculated by the 3D algorithm. Scale bar: 50 μm. The two regions shown in (c) are zoomed in to show the details of fiber orientation. (d) Original SHG intensity of region 1. (e) orientation map of region 1. Scale bar: 30 μm. The arrows shown in (d) and (e) point out the branched structure. (f) Original SHG intensity of region 2. (g) orientation map of region 2. Scale bar: 15 μm. (h) The distribution histogram of corresponding to this frame.

