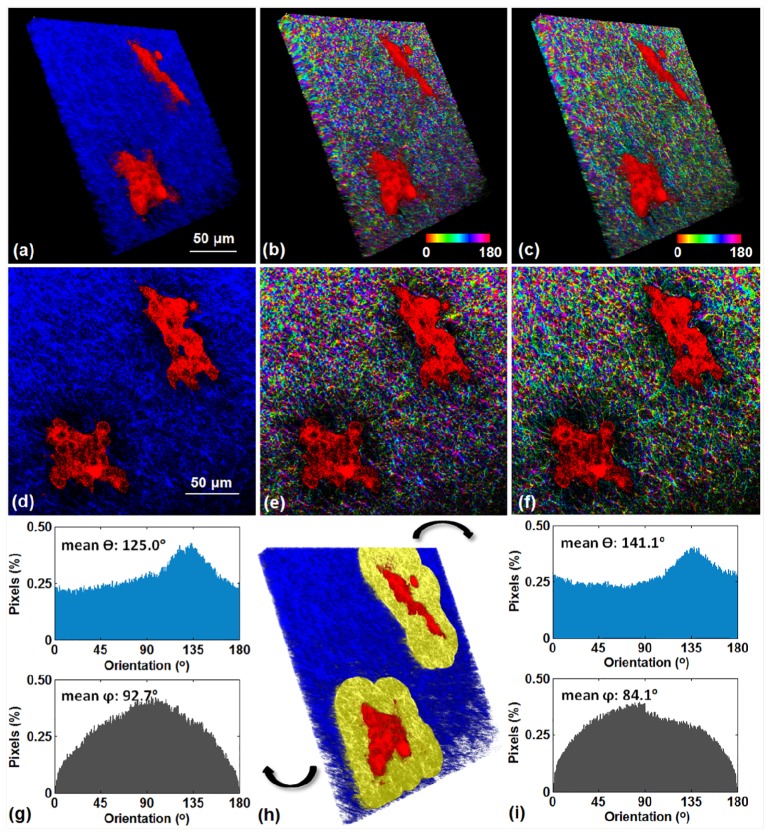
Fig. 12.
Applicability of the 3D vector summation technique to the analysis of an image stack from a 3D breast tissue model. 3D reconstructions of (a) a combination of SHG and TPEF signals, (b) and (c) orientation maps. (d), (e), and (f) show one frame of these stacks. (h) The two regions surrounding the epithelial structures marked in yellow are investigated, and the distribution histograms of both and within these two regions are shown in (g) and (i), respectively, as pointed by the arrows.

