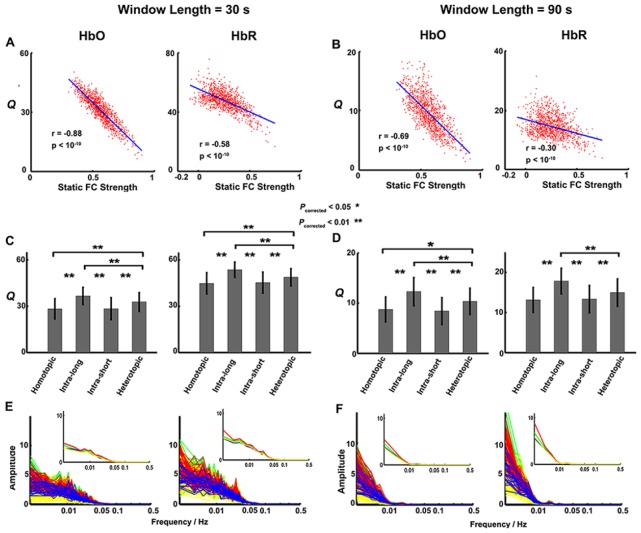
Fig. 5.
Reproducibility of the primary findings derived from HbO and HbR signals over two various sliding-window lengths (30 s and 90 s). (A, B) The negative correlation relationship between index Q and the static connectivity strength. (C, D) The group differences in values of index Q between connectivity groups. (E, F). The group-averaged power spectra of dynamic FC time series in the four connectivity groups. The lines with blue, red, yellow and green color represent the homotopic, long and short intrahemispheric and heterotopic connections, respectively. All these results show good reproducibility over varying sliding-window lengths.

