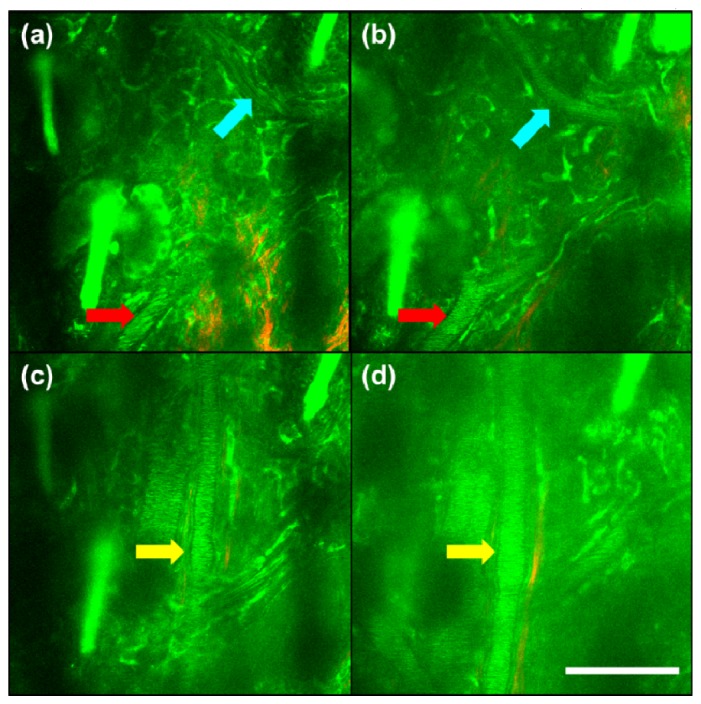
Fig. 2.

TPM images of the mouse ear at two different fixed depth at different times show vasodilation as a result of inflammation. Approximately 38% capillary vasodilation occurred between 0 h (a, c) and 1 h (b, d) images. In both (b, d) the overall background noise has increased, which seems to be caused by increased light scattering due to tissue swelling from plasma leakage. Colored arrows indicate the location of blood vessels (Scale bar: 100 μm) (Visualization 1 (6.1MB, MOV) , Visualization 2 (9.1MB, MOV) ).
