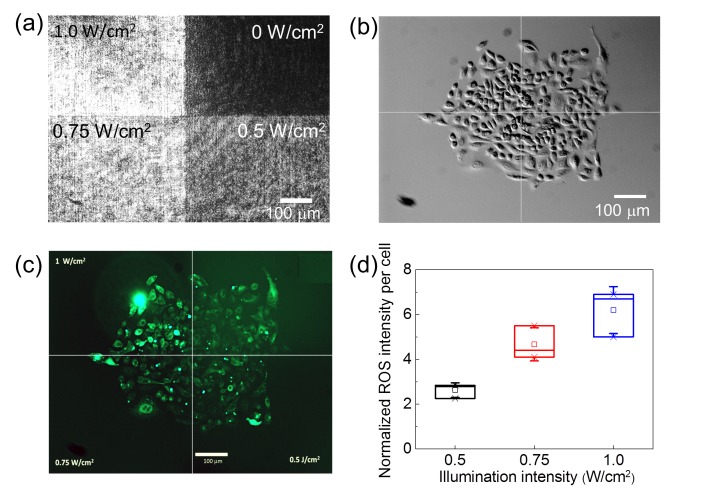
Fig. 1.
(a) The optical pattern for quantifying the intracellular levels of ROS. (b) DIC image of a group of A549 cells under the illumination of the pattern in (a). (c) Fluorescence image of a ROS indicator CM-H2DCFDA in the cells in (b). (d) Intensity of the ROS indicator per cell measured in three individual experiments. The data were normalized to that obtained from cells without the blue-light illumination.

