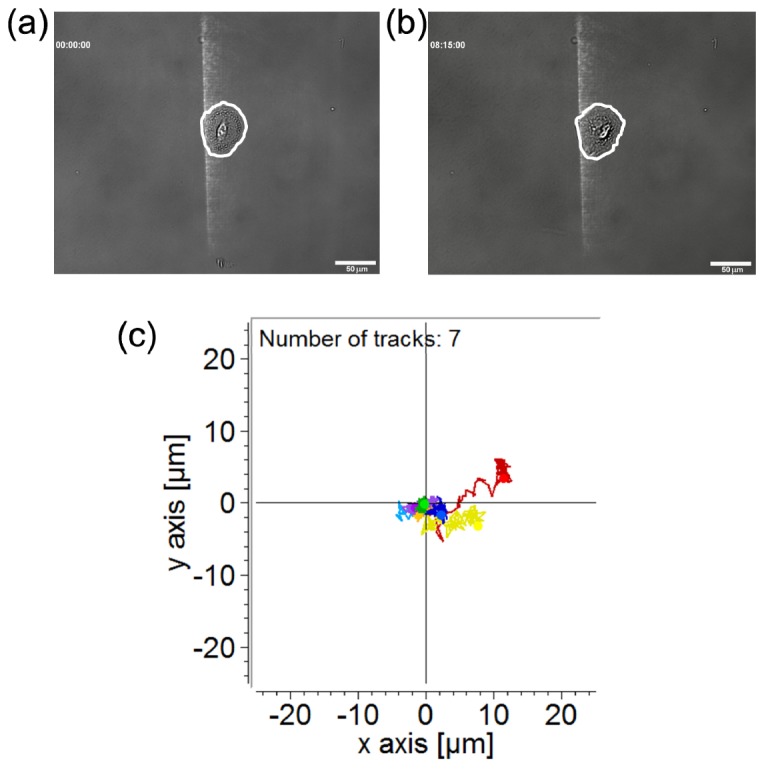
Fig. 5.

(a) Image of an A549 cell illuminated by blue light of a quartic intensity gradient with 150 μM Trolox in the culture medium at the starting point. The white line marks the cell boundary. (b) The same cell in (a) after 495 minutes of illumination. Scale bar, 50 μm. (c) Migration trajectories of 7 cells under the quartic optical intensity gradient. The recording duration is 500 minutes.
