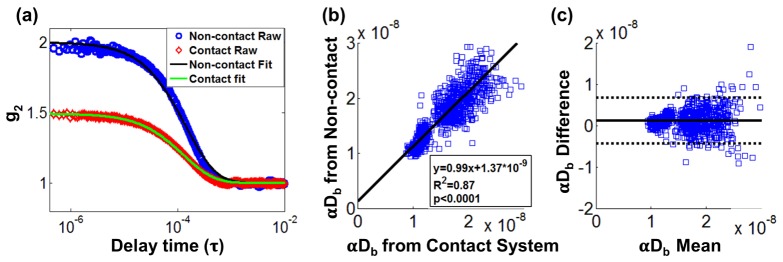
Fig. 5.

Comparison of concurrent measurements between a non-contact system and a contact system on the liquid phantom: (a) Typical normalized intensity auto-correlation function g2 from a non-contact and a contact system. Blue circles are measured data from a non-contact system. Red diamonds are measured data from a contact system. Solid lines are the corresponding semi-infinite fits to measured data from each system. (b) Linear regression analysis on extracted αDb from each system. (c) Bland-Altman plot with x-axis showing average αDb from a contact and a non-contact system, and y-axis showing the αDb difference between two systems. Dotted lines denotes the 95% confidence interval of the difference.
