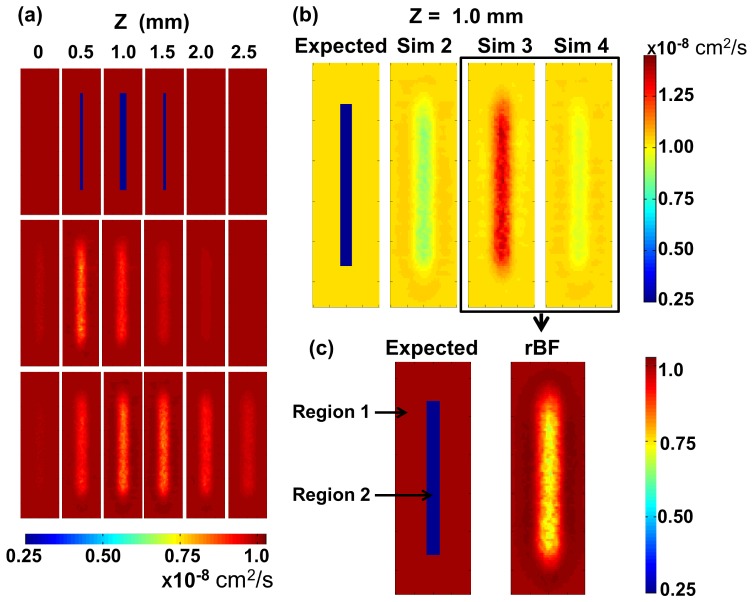
Fig. 6.
DCT reconstruction from simulated data sets. (a) z slices of αDb at different depths for expected value (Top), Simulation #1 (middle, global μs′ = 20.0 cm−1) and Simulation #2 (Bottom, global μs′ = 8.0 cm−1). (b) z slices of αDb at 1.0 mm for expected value and simulation #2-4. In simulation #3 and #4, μs′ = 8.0 cm−1 and 20.0 cm−1 were assigned for region 1 and 2 respectively simulating muscle and bone. For simulation #3, αDb = 1.0x10⁻⁸ cm2/s was assigned in both regions. For simulation 4, αDb = 0.25x10⁻⁸ cm2/s was assigned in region 2. (c) Expected relative blood flow rBF (Left) and rBF calculated by taking the ratio between αDb of simulation #4 and simulation #3 (Right). (Sim: simulation)

