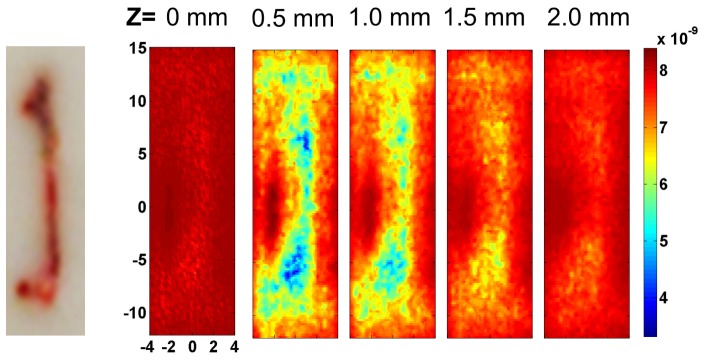
Fig. 7.

DCT reconstruction results from tissue phantom measurements. The photograph on the left shows the position of the bone with respect to the scanning area. Reconstructed images of αDb are shown at different z = 0 mm, 0.5 mm, 1.0 mm, 1.5 mm and 2.0 mm with the same color bar.
