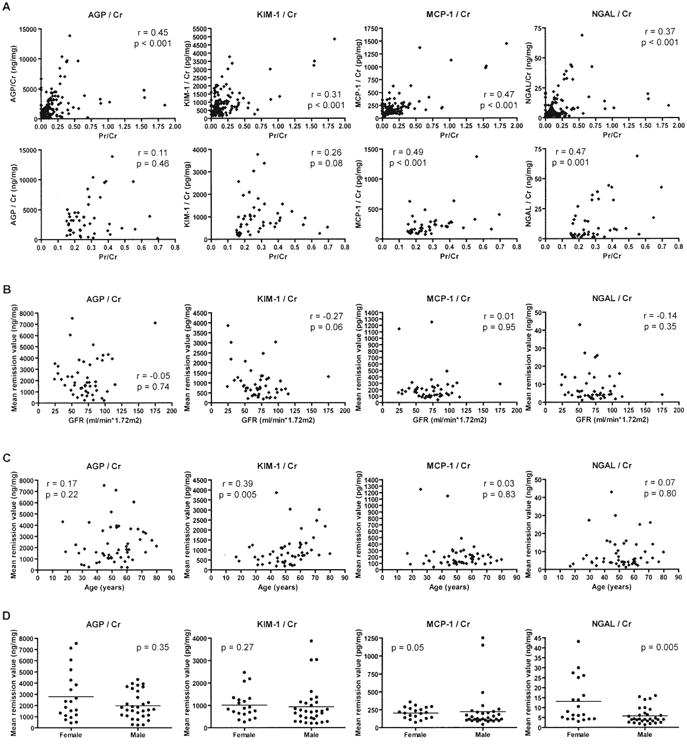
Figure 4.

Relationship between urinary biomarker concentrations and urinary protein concentration (A), glomerular filtration rate (B), age (C), and sex (D). Concentrations of all markers were divided by the urine creatinine concentration. Results of all samples are shown in the top set of panels in A; only data from samples with urine protein/creatinine (Pr/Cr) between 0.15 and 0.7 are shown in the bottom set of panels in A. In B to D, the mean remission value for each patient is plotted, and in B, glomerular filtration rate (GFR) was calculated at the last remission visit. Spearman correlation coefficients (r) and associated p values are shown; in D, p values were determined by Wilcoxon rank-sum tests. AGP: alpha-1 acid glycoprotein; KIM-1: kidney injury molecule-1; MCP-1: monocyte chemoattractant protein-1; NGAL: neutrophil gelatinase-associated lipocalin.
