
Figure 4.
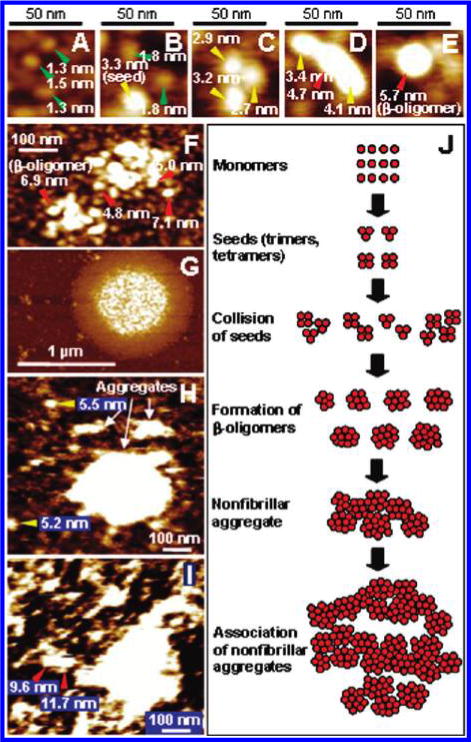
Pathway leading to formation of β-oligomers and subsequent nonfibrillar aggregates. (A–G) Ex situ images of 10OR showing (A) monomers; (B) monomers and a small oligomer (seed); (C) collision of seeds at the moment just before coalescence into one β-oligomer; (D) interaction of a seed with two oligomers; (E) a β-oligomer; (F) nonfibrillar aggregates at early stage of formation showing that they are comprised of β-oligomers (higher resolution image of yellow rectangle in Figure 3F); and (G) large aggregate formed by direct association of small, irregular nonfibrillar aggregates like those in (F) (higher resolution image of yellow rectangle in Figure 3L). (H and I) Sequential in situ images captured in the same spot on mica showing small oligomers (seeds) and aggregates composed of β-oligomers. Following collection of (H), freshly mixed 10OR solution (partially denaturing) was added, and image (I) was collected. It shows growth of the aggregates in (H) as well as a newly formed aggregate composed of two β-oligomers with heights 9.6 and 11.7 nm. For solution preparation conditions, see the Experimental Section. (See also Figure S9 for details.) (J) Schematic of observed pathway to formation of β-oligomers and subsequent nonfibrillar aggregates illustrating multiple stages of association by stable oligomeric intermediates.