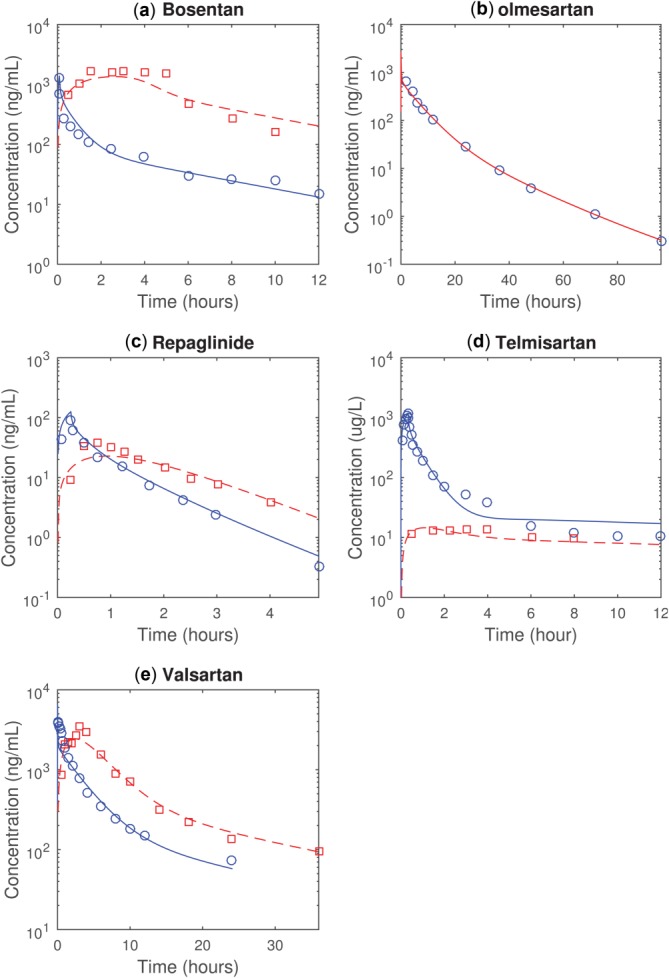
Figure 1.

The observed and simulated mean plasma concentration time profiles in healthy individuals of (a) bosentan (10 mg 5-minute intravenous infusion and 125 mg oral dosing), (b) olmesartan (8 mg intravenous bolus dosing), (c) repaglinide (2 mg 15-minute intravenous infusion and 4 mg oral dosing), (d) telmisartan (40 mg 20-minute intravenous infusion and 40 mg oral dosing), and (e) valsartan (20 mg intravenous bolus and 160 mg oral dosing). The blue circles and solid lines represent the observations and simulations following intravenous dosing. The red squares and dashed lines represent the observations and simulations following oral dosing. The simulations are performed with parameter values for healthy individuals given in Table 1.
