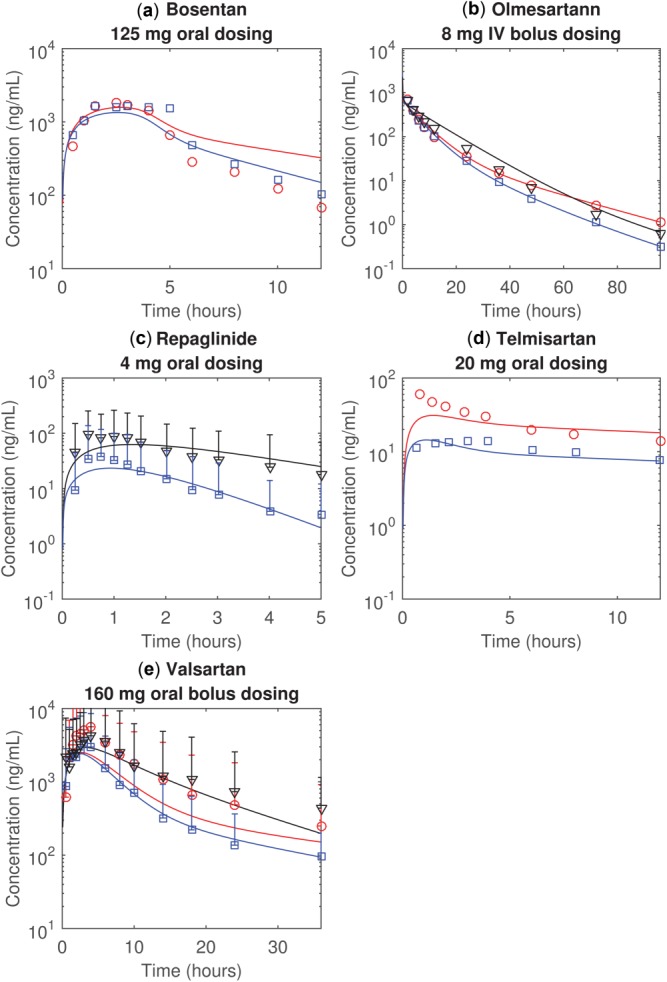
Figure 3.

The observed and simulated plasma concentration time profiles of (a) bosentan, (b) olmesartan, (c) repaglinide, (d) telmisartan, and (e) valsartan. The blue, red, and black represent the healthy individuals, patients with CP-A liver cirrhosis, and the patients with CP-B liver cirrhosis, respectively. The markers (i.e., squares, circles, and triangles) represent the observations. The solid lines represent the simulations assuming all uptake transporters are equally affected by the liver cirrhosis conditions and Rtransporter is fitted (Method 2). All simulations assume the biliary efflux transporters are equally affected by the liver cirrhosis, and the impact of cirrhosis on all transporters depends on Child–Pugh scores. Error bars indicate 95% prediction intervals estimated using observed standard deviations.
