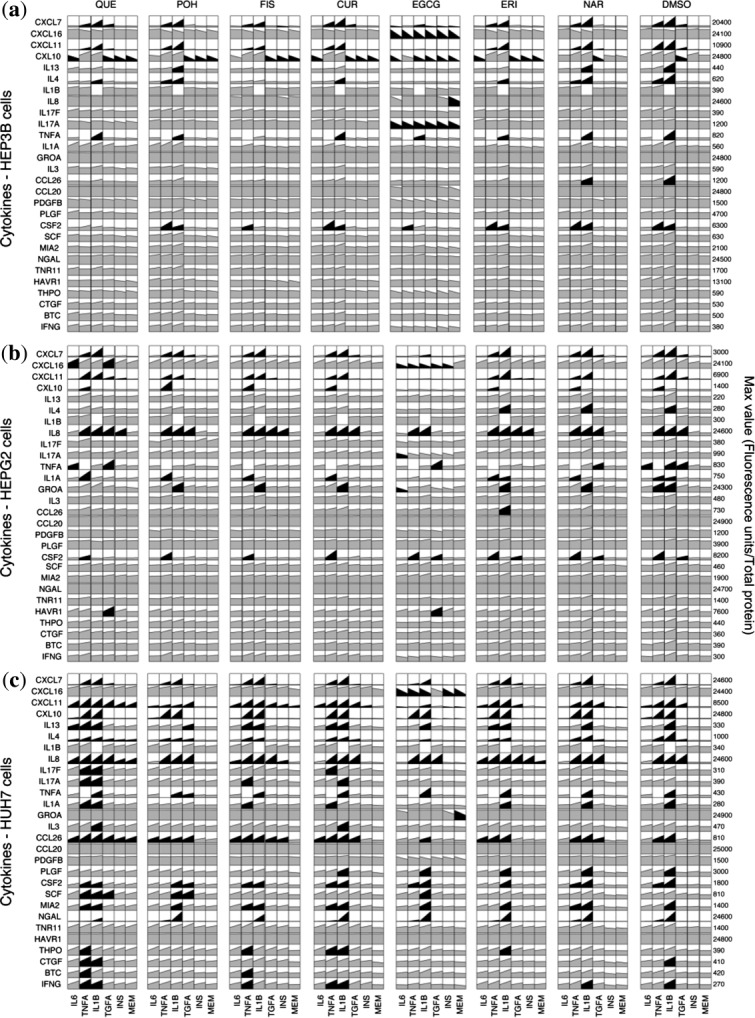
Figure 1.

Cytokine xMAP datasets from (a) HEP3B, (b) HEPG2, and (c) HUH7 cells. Rows represent measurements (mean values) of secreted cytokines 24 hours posttreatment. Columns correspond to treatment with indicated stimulus or minimum essential medium (MEM). Column blocks designate treatment with indicated compound or DMSO vehicle. Black color highlights signals that exceeded a 2-fold threshold alteration compared to DMSO-MEM. Mean values ± SEM (2–3 experiments) and data transformation of fluorescence units to pg/ml are provided in Appendices I and II of the Supplementary Material, respectively.
