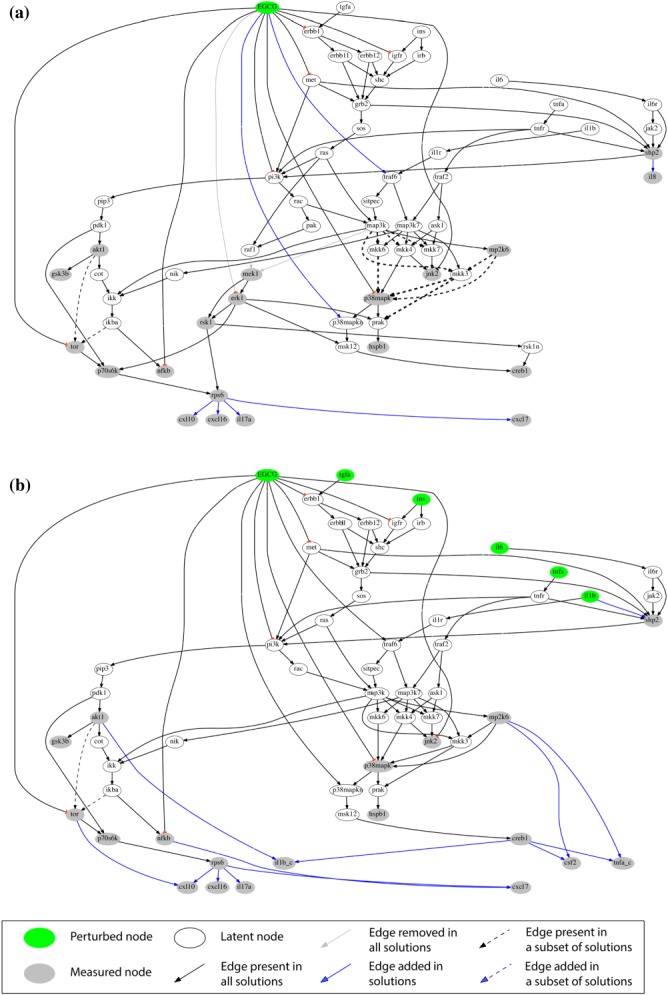
Figure 3.

Compound-specific signaling networks in HEP3B cells treated with EGCG under (a) basal and (b) stimulated conditions. Compound→phosphoprotein expression→cytokine release pathways were constructed from xMAP data and a reference network with canonical pathways using an adapted SigNetTrainer method. Black, opaque edges correspond to interactions that were found to be functional based on the data at hand and were conserved in the solution. Gray edges correspond to interactions that were found to contradict with the data and were thus removed from the solution. Black dashed edges correspond to interactions that may be functional or not, depending on the data discretization threshold used. The thickness of the dashed lines corresponds to the number of solutions (for different thresholds) that support the respective interaction. Blue edges correspond to interactions that were added by the algorithm for explaining patterns in the data that could not be fitted with solely removing interactions from the canonical pathway. Abbreviations are explained in Appendix IV of the Supplementary Material.
