Figure 6.
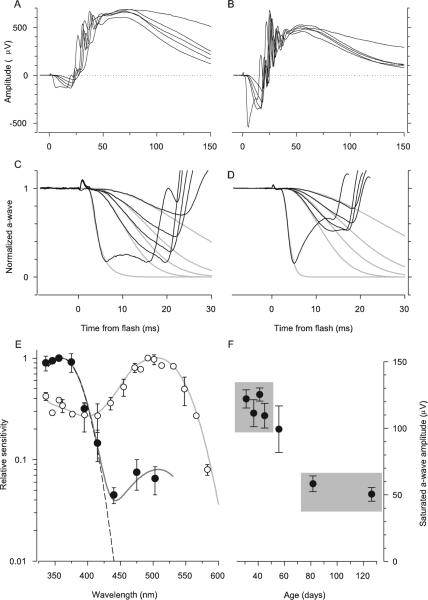
Comparison of the properties of the ERG a-wave responses of Nrl−/− and WT mice. (A) ERGs of an Nrl−/− mouse obtained in response to a series of 360-nm flashes that produced a-waves. The flash intensities were 7,400, 21,000, 36,400, 68,000 in photons/μm2 at the cornea. The most intense flash was an unattenuated white flash and saturated the a-wave amplitude. (B) ERGs of a WT mouse obtained in response to the same series of flashes as was used in the experiment in (A). The a-wave components of the responses of the Nrl−/− mouse in (A) have been extracted and normalized and fitted with a model of the activation phase of phototransduction (C),18,19 modified to incorporate the membrane time constant,22 which was set to 2 ms. The amplification constant obtained from fitting the model is A = 3.6 s−2 (cf. equation 1). (D) The a-wave components of the responses of the WT mouse (B) have been normalized and analyzed with the model, with a membrane time constant of 1 ms. The amplification constant of the same mouse obtained from fitting the cascade model to the a-wave responses to 500-nm flashes (data not shown) is A = 10 s−2; the theory traces in (D) were obtained with this value of A, and a spectral sensitivity factor at 360 nm of S360 = 0.3. (E) Spectral sensitivities of the a-wave of Nrl−/− (●) and WT mice (○). Results such as those shown in (C) and (D) were analyzed as described in Lyubarsky et al.15 to extract the spectral sensitivities. Dark gray curve through the Nrl−/− data was derived by combining a pigment template69 having λmax = 360 nm and unit sensitivity with a second template with λmax = 508 nm and maximum sensitivity of 0.08; dashed curve: 360-nm template alone. The light gray curve through the rod data (○) is a 500-nm template above 470 nm and a fifth-order spline below 470 nm. The rod data and template curves are taken from Lyubarsky et al.15 (F) The saturating amplitude amax of the a-wave of Nrl−/− mice as a function of age, derived from experiments such as illustrated in (A). Each point is the mean ± SEM of a group of 6 to 10 mice (except the initial point, for which n = 5) and is plotted at the mean age of the group. For each mouse the responses from both eyes to at least 5 (but up to 20) saturating flashes were averaged to estimated amax. Gray rectangles identify two groups of mice: average age 39 days (top left; n = 33); average age 104 days (bottom right; n = 13). The difference in amax between these two groups was significant at P < 10−9 (two-sample t-test, df = 35).

