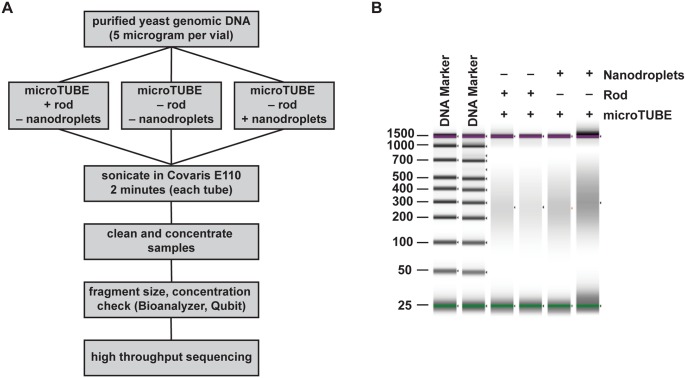
Fig 3. Nanodroplet-mediated DNA fragmentation compared to a commercial method.
(A) Flow chart outlining method for comparing DNA fragmentation methods. (B) False gel picture from Agilent D1000 ScreenTape system showing DNA fragment size distribution in base pairs for samples fragmented in the Covaris E110 sonicator. Purple bars indicate the upper (1,500 bp) molecular weight marker and green bars indicate the lower (25 bp) molecular weight marker in each lane.

