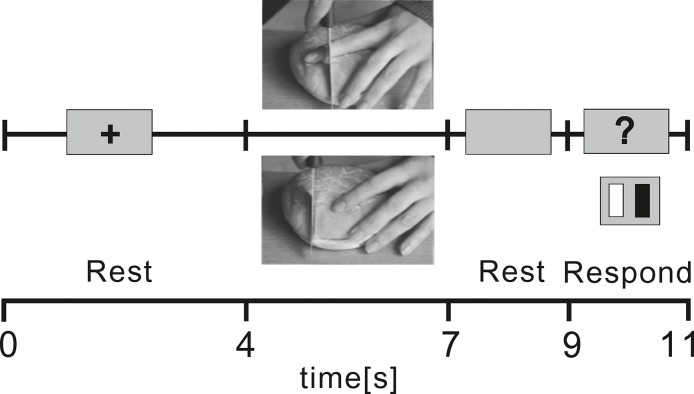
Fig 1. Flowchart of the experiment.
The figure illustrates one trial of the experiment, beginning with a rest period (4 s) and continuing with a visual presentation of a pain or non-pain picture for 3 s, followed by another rest period of 2 s, and a response period of 2 s during which subjects pressed left or right button on a response pad to indicate whether the photograph depicted a pain or non-pain scene.

