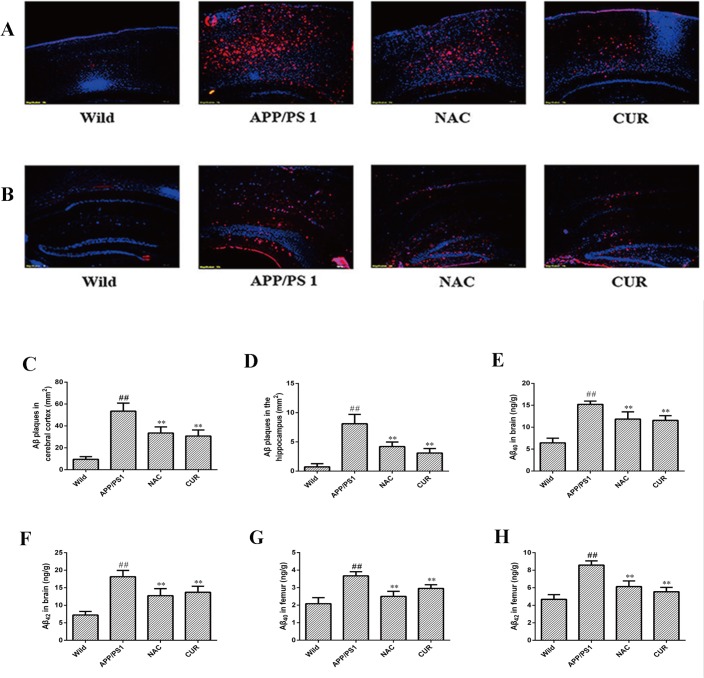
Fig 2. CUR reduced the levels of Aβ both in the brain and bone.
Total Aβ plaques (red) were detected with antibodies in the cortex (A), and hippocampus (B). Cell nuclei were stained with DAPI (blue). Scale bars represented 100 μm. Number of total Aβ plaques plaques in the cortex (C) and hippocampus (D). CUR decreased the levels of Aβ40 (E) and Aβ42 (F) in brain, and decreased the levels of Aβ40 (G) and Aβ42 (H) in femur. Results are represented as the mean ± SD (n = 10). #: P < 0.05 compared to the wild mice group; ##: P<0.01 compared to the wild mice group *: P<0.05 compared to the APP/PS1 mutated transgenic mice group; **: P<0.01 compared to the APP/PS1 mutated transgenic mice group.

