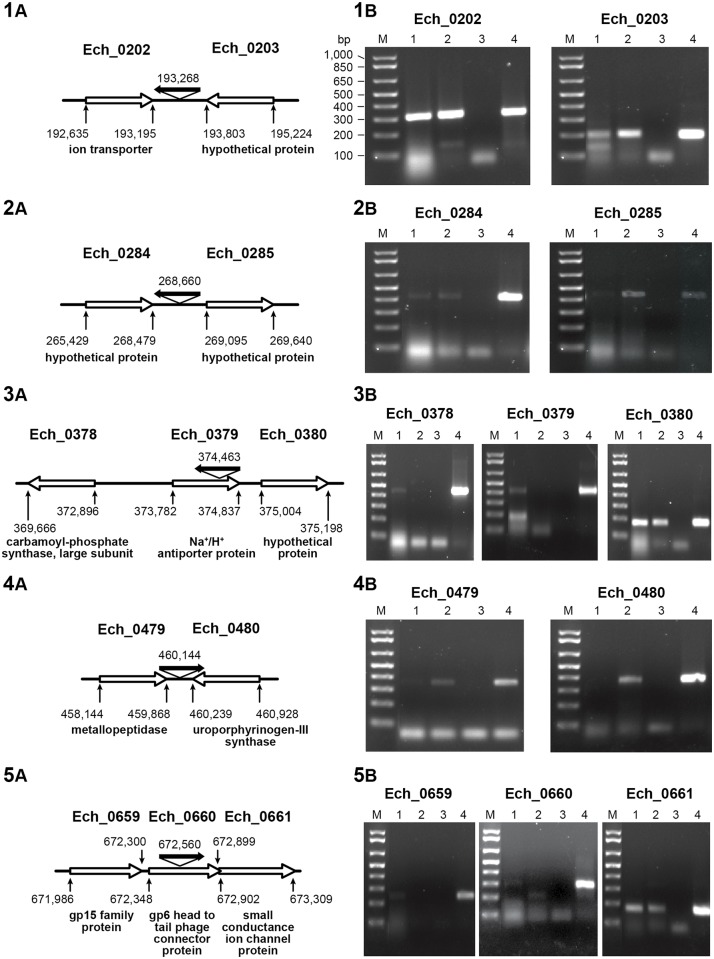
Fig 2. Transcriptional analysis of genes upstream and downstream from five clonal mutants.
Genomic DNA-free total RNA from wild-type E. chaffeensis (lane 1) and clonal mutants (lane 2) was assessed for the genes 5’ and 3’ to insertion sites by semi quantitative RT-PCR. Panels 1A-5A have the cartoons depicting the insertions and their orientations within the genome and the genes near the insertions. The annotated/predicted gene names near the insertions were provided in each sub-panel. Panels 1B-5B had RT-PCR products resolved on agarose gels for each of the respective genes as in panels 1A-5A. No template controls (lane 3) and wild type genomic DNA template reactions (lane 4) were included to serve as negative and positive controls for each reaction, respectively. M represents 1 kb plus DNA ladder (Life Technologies. Carlsbad, CA). Molecular sizes of the resolved DNA ladder shown in the Figs are the same for each sub-panels and were identified in the left image of panel 1B. Predicted amplicon for each gene was listed in Table 1. The primer binding locations relative to whole genome data were also provided in Table 1.

