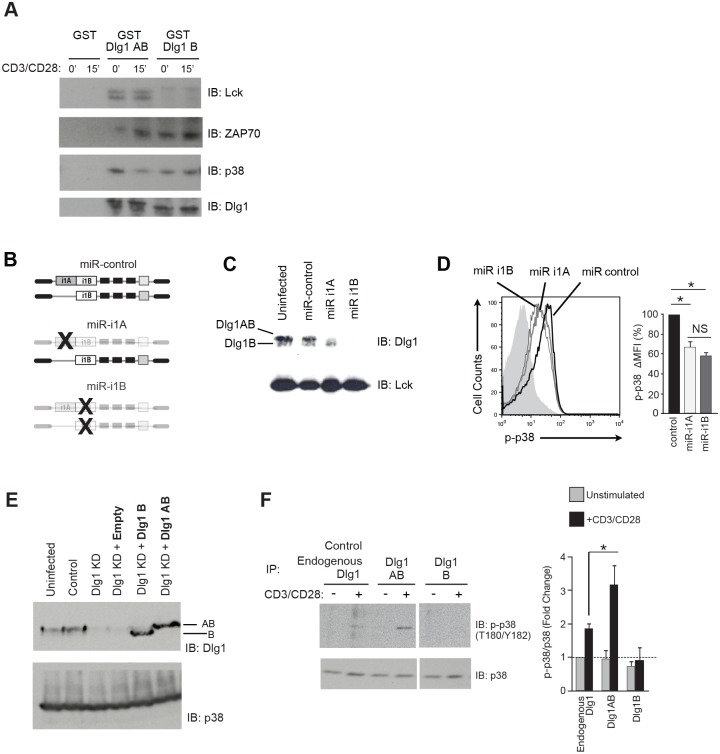
Fig 2. Dlg1AB selectively associates with Lck and supports optimal p38 phosphorylation while Dlg1B does not.
(A) GST-tagged Dlg1AB and Dlg1B or GST-alone were incubated with protein lysate from unstimulated (0min) or stimulated (15min) T cells. Associated Lck, ZAP70 and p38 were identified by immunoblot. (B) Schematic representation of Dlg1 variants targeted for knockdown using miR-based knockdown viruses. (C-D) Purified primary OT-1 CD8+ T cells were stimulated with anti-CD3/anti-CD28 followed by infection with miR-based viruses. (C) SDS-PAGE of cell lysates assessing Dlg1 knockdown. (D) Cells were restimulated with anti-CD3/anti-CD28 for 30mins and stained for p-p38 (T180/Y182). CD8+GFP+ cells were gated and histograms of phosphorylated p38 are shown. The percentage of p38 phosphorylation relative to miR-control is quantified as ΔMFI (%), where ΔMFI = stimulated MFI—unstimulated MFI, and where miR-control is set to 100%. Error bars represent SD of means from three independent experiments. *p < 0.05. (E-F) OT-1 hybridoma T cells were infected with the indicated Dlg1 re-expression (bold) and/or Dlg1knockdown (KD) viruses. The Dlg1 knockdown (Dlg1 KD) construct targets the 3’UTR of dlg1 allowing re-expression of specific Dlg1 splice variants. (E) Cells were analyzed via protein immunoblotting for Dlg1; p38 was used as a loading control. (F) OT-1 hybridoma T cells expressing endogenous Dlg1 or selectively re-expressing Dlg1AB or Dlg1B were left unstimulated (-) or stimulated with anti-CD3/anti-CD28 (+) for 15 mins, followed by immunoprecipitation with anti-Dlg1 and assessed for bound p38 T180/Y182 phosphorylation via immunoblotting (left). Fold change in densitometry of phospho-p38 relative to total p38, with the unstimulated endogenous Dlg1 condition normalized to 1.0 (denoted by the horizontal doted line) is shown (right). Error bars represent SD of means from three independent experiments. *p < 0.05.

