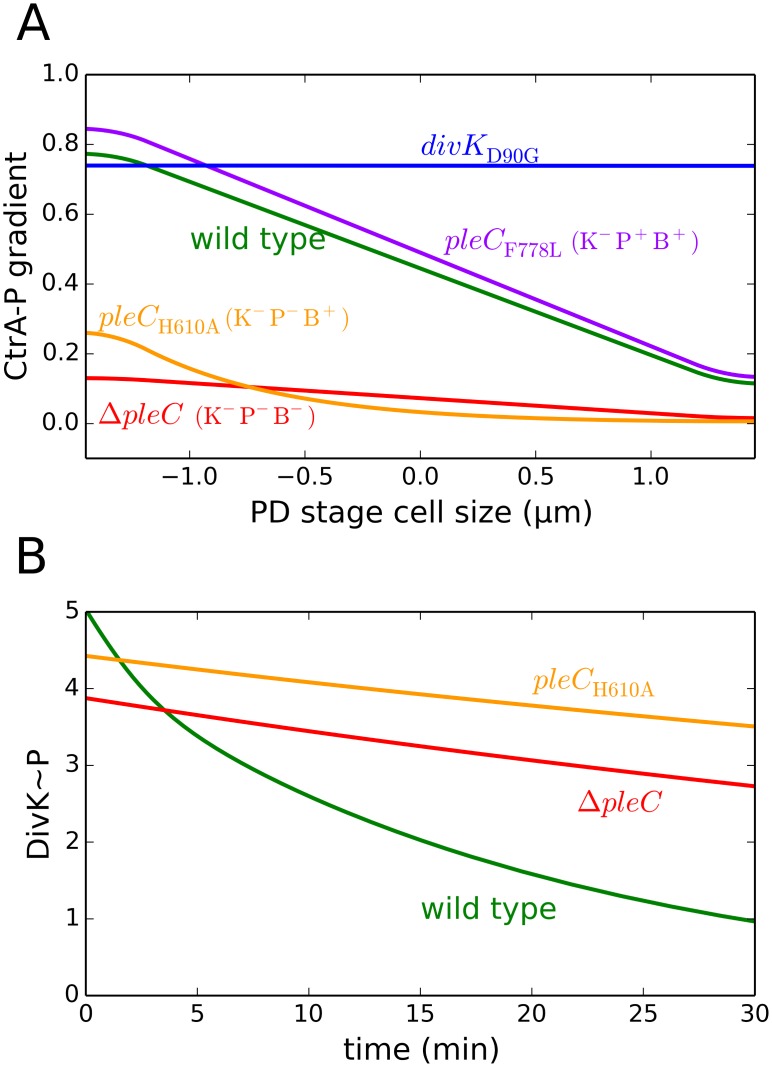
Fig 8. The model simulates distribution patterns of CtrA~P and DivK~P in mutant cells.
(A) Model simulations predict the concentration gradient of CtrA~P prior to cytokinesis (t = 120 min) in mutant cells: pleC F778L (purple), divK D90G (blue), ΔpleC (red) and pleC H610A (yellow). The distribution for the wild-type cells is plotted in green for reference. (B) The model reproduces the inadequate dephosphorylation of DivK~P observed in the swarmer compartment of post-compartmentalized cells in the ΔpleC (red) and pleC H610A (yellow) mutant strains.

