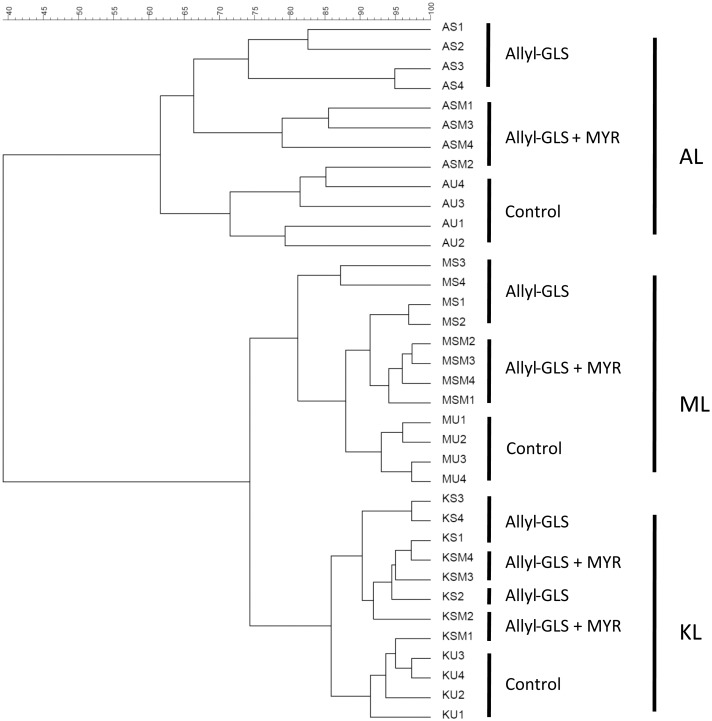
Fig 3. Cluster analysis of bacterial communities from soils as the effect of allyl-GLS and allyl-GLS + myrosinase (MYR) seven days after treatment.
Displayed are all four replicates (1–4), Gel-Compar II 6.5. Soil treated in a similar way but without the addition of GLS-treatment was used as a control. The first letter (A, M, or K) indicates the soil, the second letter(s) indicate(s) the treatment (S: sinigrin = allyl-GLS; SM: sinigrin + MYR; U: untreated = control), and the numbers 1–4 indicate the repetitions.

