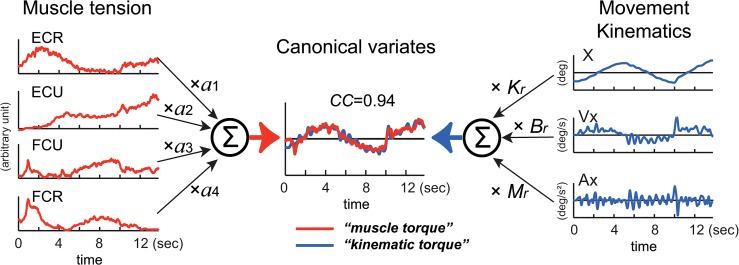
Fig 3. Explanation of the relationship between muscle tension and movement kinematics modeled in Eq (1).
The left side represents the middle of Eq (1). EMG activities of the four muscles (ECR, ECU, FCU, FCR) converted into muscle tension are linearly summed (∑) after multiplying parameter a 1–a 4, respectively to obtain muscle torque in the center (red line) (see Materials and Methods). The right side represents the right side of Eq (1). Acceleration (Ax), velocity (Vx) and position (X) of the wrist joint are summed (∑) after multiplying the inertia parameter (M), the viscous coefficient (B r) and the elastic coefficient (K r), respectively to obtain kinematic torque in the center (blue line) (see Materials and Methods). We used a canonical correlation analysis (CCA) to obtain values of these parameters. The two canonical variates, muscle torque and kinematic torque, were calculated by substituting the values for the fitting parameters in Eq (1). Note the high canonical correlation (CC = 0.94) between the two canonical variates (in Estimated torque). This Fig explains calculation of torque around the x-axis, but the same method applies to calculation of torque around the y-axis.

