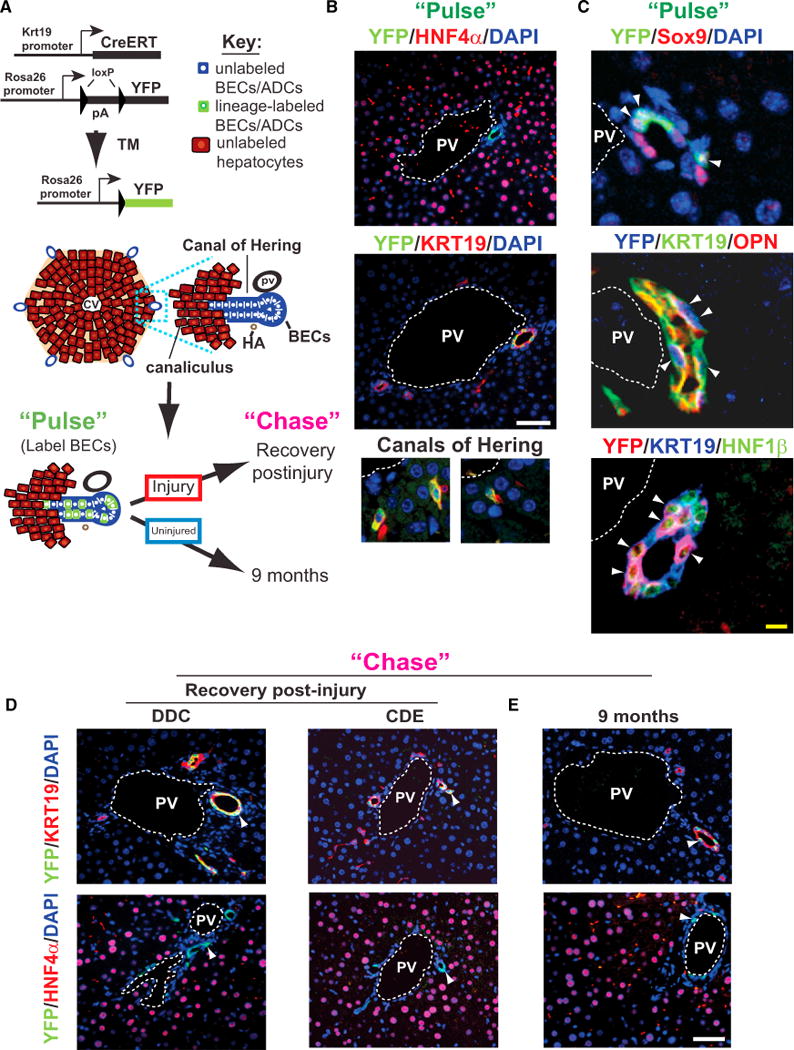
Figure 1. BECs Lack Detectable Progenitor Cell Activity In Vivo.

(A) Schematic view of BEC labeling using Krt19-CreER;R26YFP mice. An idealized hexagonally shaped lobule is shown. A blow-up of one portal tract illustrates the interface between BECs (blue) and hepatocytes (crimson). Cells are marked in a mosaic fashion on tamoxifen injection (“Pulse”), and the ability of labeled BECs to give rise to hepatocytes is assessed following injury and recovery or under long-term (9 month) homeostatic conditions (“Chase”).
(B) YFP-labeling at “pulse.” Labeling occurs exclusively in BECs that are negative for HNF4a (top panel) and positive for Krt19 in ducts (middle panel) or within the Canals of Hering (bottom panels).
(C) Costaining of the YFP label with the BEC markers Sox9, OPN, and HNF1β (arrowheads mark double positive/triple cells).
(D) Following injury-recovery, a similar pattern and degree of labeling is observed after the chase; no YFP label is observed in hepatocytes (“Chase”–DDC and CDE).
(E) Livers from Krt19-CreER; R26YFP mice examined 9 months after tamoxifen injection do not show any hepatocytes bearing the YFP label (“Chase”–9 months). Images shown are representative of multiple experiments (pulse: n = 7; DDC: n = 8; CDE: n = 3; 9 months chase group: n = 5).
TM, tamoxifen; CV, central vein; PV, portal vein; HA, hepatic artery. White scale bars, 50 mm, yellow scale bar, 5 mm. See also Figure S1.
