
FIG. 4.
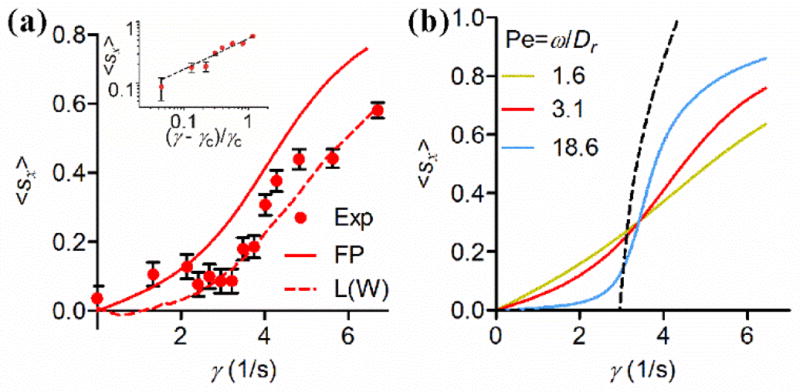
Onset of upstream swimming via a saddle-node transition. (a) The average value of sperm head orientation unit vector along the x-direction (or against the flow direction) 〈sx〉 versus shear rate γ. Red dots are experimental measurements, red solid line is the solution of the Fokker-Planck equation, and dashed line is the results of Langevin simulation taking into account the wiggling motion. Error bars show standard errors of the mean. Inset: a power law with exponent of 0.53 ± 0.05 is observed above γc for measured 〈sx〉 versus γ curve. The black dashed line is a guideline with an exponent of 0.5. (b) Numerical solution of the Fokker-Planck equation showing that the transition curve becomes steeper with increasing Péclet number (Pe). In the high Pe asymptotic limit, it approaches the black dashed line described by .