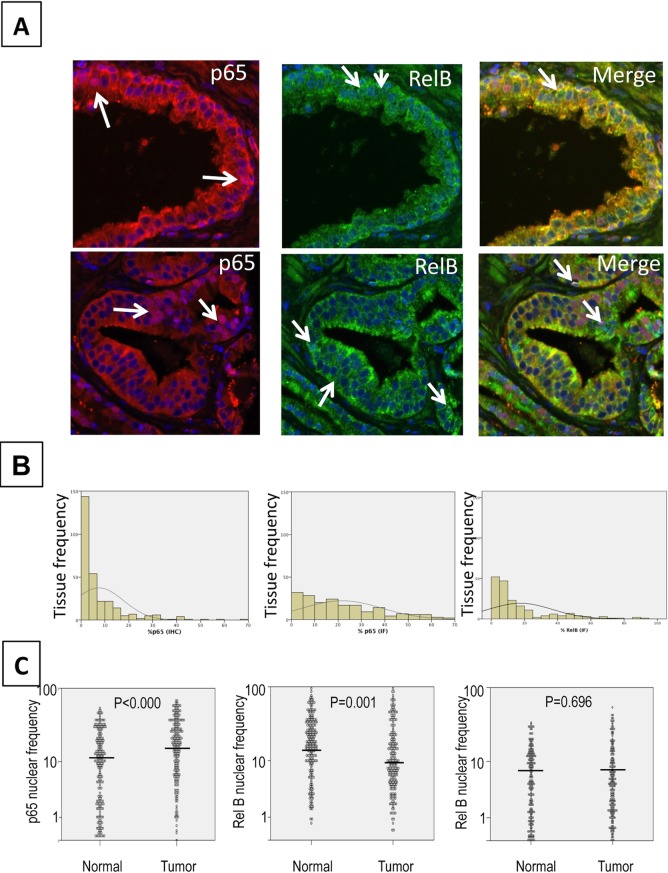
Fig 2. Example of immunofluorescence of p65 and RelB.
A. Magnification (40X) highlighting glandular structures in prostate cancer tissues. Merge: superimposed images of RelB (A488) in green, p65 (Cy5) in red and nuclei (DAPI) in blue, in normal adjacent (top) or cancer tissues (bottom). Arrows show stained nuclei. B. Comparative quantification from IHC (left) and IF (right) staining of p65. Graphs show the frequency distribution of nuclear p65 as evaluated visually (IHC) or automatically (IF). C. Frequency of nuclear p65 (left), RelB (middle) and double stained nuclei (right) in normal adjacent and tumor tissues. The comparison between adjacent normal and tumor cores was conducted using a Wilcoxon‘s test.

