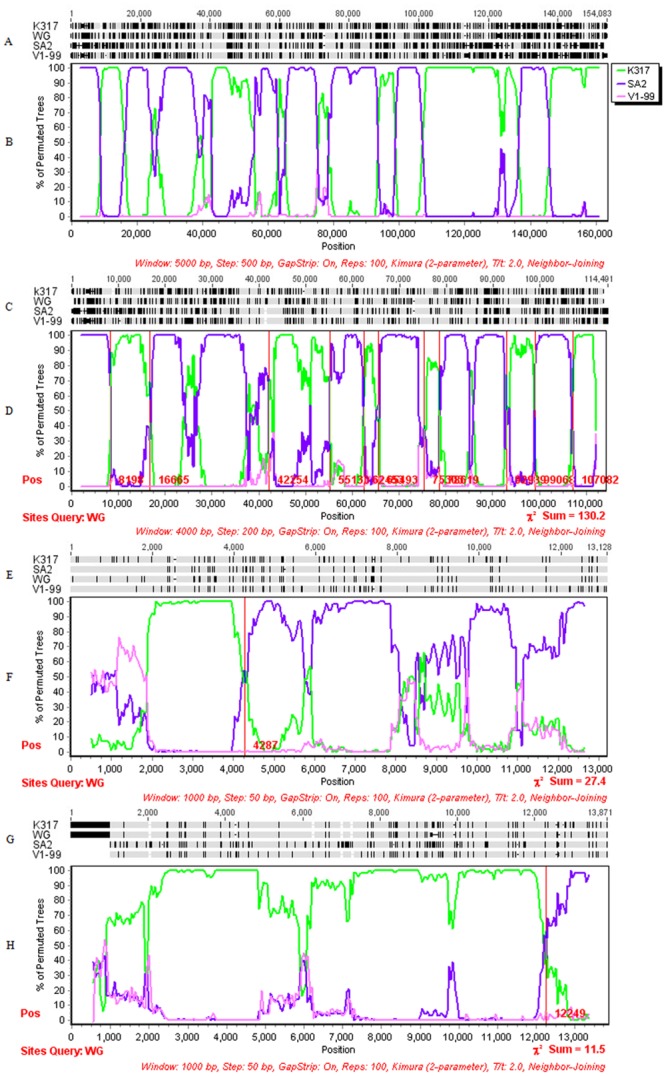
Fig 8. Bootscan analysis of crossover points in different subregions of WG strain with reference strains.

Alignments and Bootscan analyses were produced in complete genome (A, B), the UL region (C, D), the Us region (E, F), and IRs region (G, H) using WG strain as query sequence, SA2, K317 and V1-99 strains as parental sequences or control, respectively. The crossover points of predicting recombination events are marked on the Bootscan maps of different subregions. The Chi-square (x2) value of heterogeneity between adjacent regions is shown on the bottom right of each map (p < 0.001). All values have 1 degree of freedom.
