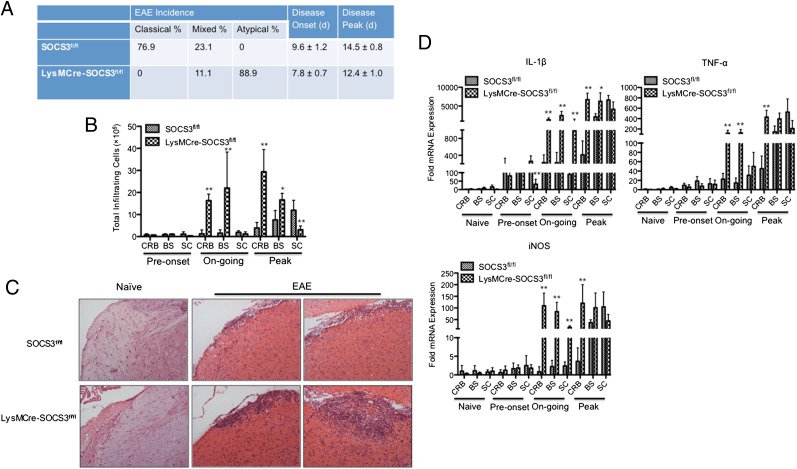
FIGURE 1.
Deletion of SOCS3 in myeloid cells causes atypical EAE. (A) SOCS3fl/fl (n = 26) or LysMCre-SOCS3fl/fl (n = 36) mice were immunized with MOG35–55 peptide. The mice received i.p. injections of 500 ng pertussis toxin on days 0 and 2. Data were pooled from at least five experiments. (B) Representative graph illustrating quantitative data for absolute numbers of total infiltrating mononuclear cells in the CRB, BS, and SC from SOCS3fl//fl mice with classical EAE or from LysMCre-SOCS3fl//fl mice with atypical EAE during disease development. Preonset (clinical scores of 0–1 at days 9–10 for classical EAE in SOCS3fl/fl mice or at days 5–6 for atypical EAE in LysMCre-SOCS3fl//fl mice), ongoing (clinical scores of 1–3 at days 11–13 for classical EAE in SOCS3fl/fl mice or at days 7–10 for atypical EAE in LysMCre-SOCS3fl//fl mice), and peak (clinical scores of 3–4 in classical EAE at days 14–18 for classical EAE in SOCS3fl/fl mice or at days 11–15 for atypical EAE in LysMCre-SOCS3fl//fl mice). Mean ± SD numbers of total infiltrating cells in different CNS compartments were compared between SOCS3fl/fl and LysMCre-SOCS3fl/fl mice. (C) H&E staining of BS sections at the peak of disease from SOCS3fl/fl mice with classical EAE or LysMCre-SOCS3fl/fl mice with atypical EAE, as well as BS sections from naive SOCS3fl/fl and LysMCre-SOCS3fl/fl mice (original magnification ×10). Representative sections from each group are shown. (D) CRB, BS, and SC mRNA were isolated at the indicated disease stages for RT-PCR analysis of IL-1β, TNF-α, and iNOS. Data represent fold induction compared with naive SOCS3fl/fl CRB. Fold induction of indicated genes in different CNS compartments was compared between SOCS3fl/fl and LysMCre-SOCS3fl/fl mice at the indicated disease stages. *p < 0.05, **p < 0.01.

