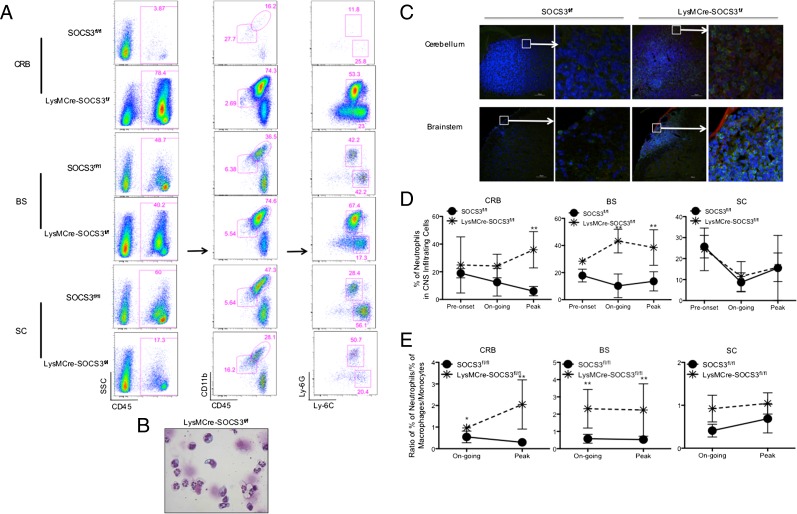
FIGURE 2.
Neutrophil infiltration into the CRB and BS is prominent in atypical EAE. (A) CRB-, BS-, and SC-infiltrating mononuclear cells were isolated from SOCS3fl/fl mice with classical EAE (score of 3) or from LysMCre-SOCS3fl/fl mice with atypical EAE (score of 3). They were first gated on CD45+, and then gated on CD11b, Ly-6C, and Ly-6G. Representative flow cytometry plot of neutrophils is shown (n = 10 mice/group). Neutrophils were defined as CD45+CD11b+Ly-6ClowLy-6G+, and macrophages/monocytes were defined as CD45+CD11b+Ly-6ChighLy-6G−. (B) CRB-infiltrating mononuclear cells isolated from LysMCre-SOCS3fl/fl mice at the peak of atypical EAE were cytospinned, and slides were stained with Diff Quik. (C) Immunohistochemistry staining of CRB and BS sections at peak of disease from SOCS3fl/fl mice with classical EAE or LysMCre-SOCS3fl/fl mice with atypical EAE. Sections were stained with Ly-6G Ab (green), SMI-32 Ab (red), and Hoechst (blue). Representative sections from each group are shown (n = 4 mice/group). Bar size of 30 μm is shown. (D) Representative graph of three individual experiments illustrating quantitative data for percentage of accumulated neutrophils in total CNS-infiltrating cells from CRB, BS, and SC at the indicated clinical phases from SOCS3fl/fl mice with classical EAE or LysMCre-SOCS3fl/fl mice with atypical EAE (n = 3 mice/group). Mean ± SD. Percentage of neutrophils in CNS-infiltrating cells in different CNS compartments was compared between SOCS3fl/fl and LysMCre-SOCS3fl/fl mice at the indicated disease stages. (E) Representative graph from three individual experiments illustrating ratio of percentage of accumulated neutrophils to percentage of accumulated macrophages/monocytes from the CRB, BS, and SC at the indicated clinical phases from SOCS3fl/fl mice with classical EAE or LysMCre-SOCS3fl/fl mice with atypical EAE. Mean ± SD (n = 3 mice/group). *p < 0.05, **p < 0.01.

