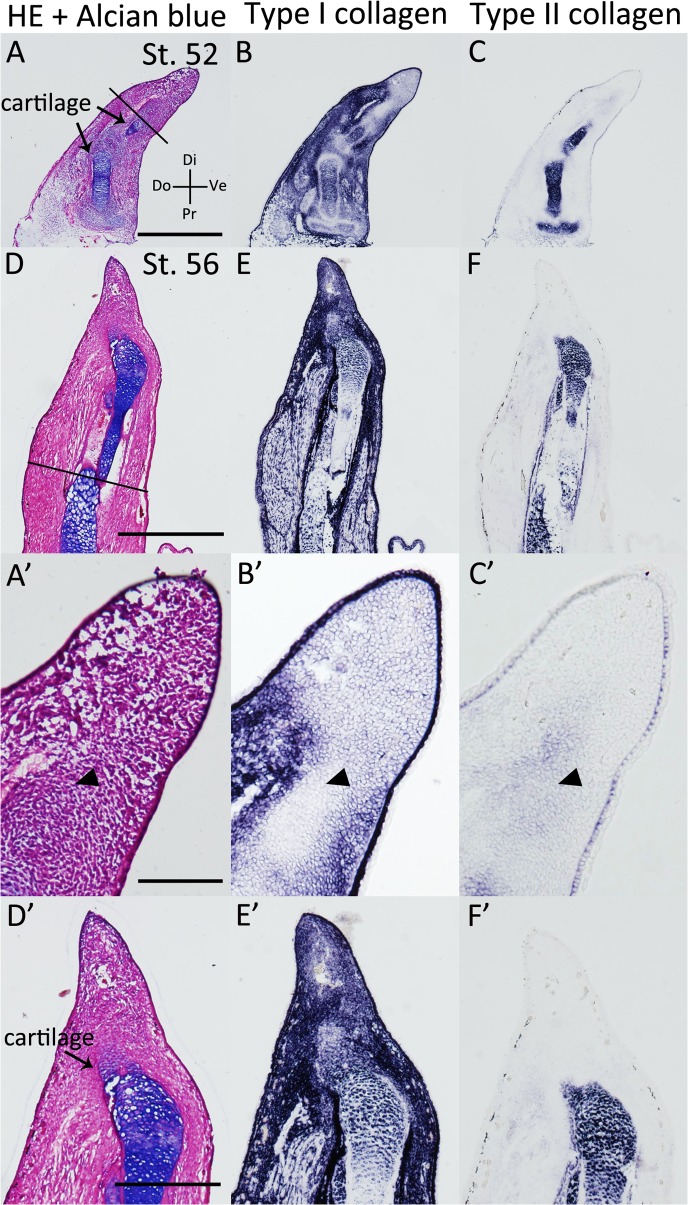
Fig 5. Type I and Type II collagen expression patterns in Xenopus stage 52 and stage 56 limb bud blastemas.
(A-C) On day 10 following zeugopod amputation at st. 52 limb bud. (A) HE and Alcian blue staining. (B) Type I collagen expression. Type I collagen expression was weak in the distal region. (C) Type II collagen expression. (D-F) On day 10 following zeugopod amputation at st. 56 limb bud. (D) HE and Alcian blue staining. (E) Type I collagen expression. Type I collagen expression was observed throughout the entire mesenchymal region. (F) Type II collagen expression. A-C are shown at the same magnification. D-F are shown at the same magnification. A’-F’ are higher magnification images of A-F, respectively. Scale bars in A, D, C’, D’, are 200 μm, 500 μm, 1 mm, 250 μm, respectively. Black bars indicate amputated planes. Arrowheads indicate estimated cartilage forming areas.

