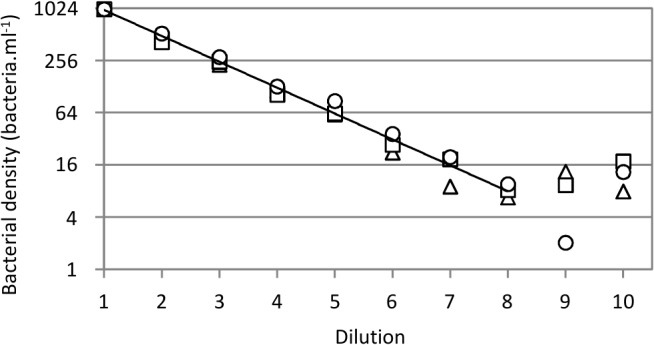
Fig 3. Determination of minimal detectable cell count of infected E. coli TD2158.

Serial 2-fold dilutions from 103 to 2 bacteria.ml-1 are numbered from 1 to 10. Each dilution was infected with the HK620::PrrnB-gfp phage and incubated for 1 hour at 30°C. The bacterial cell count was determined using the A50 Apogee flow cytometer. This assay was repeated three times and each replicate is represented with the following symbols: triangle, replicate 1; square, replicate 2; circle, replicate 3. The trend line obtained from the mean of normalized values (1,000 cells.ml-1 starting cell count) is drawn on the chart. The correlation coefficients (dilutions from 1 to 8) were 0.993, 0.995 and 0.997 for replicates 1, 2 and 3, respectively.
