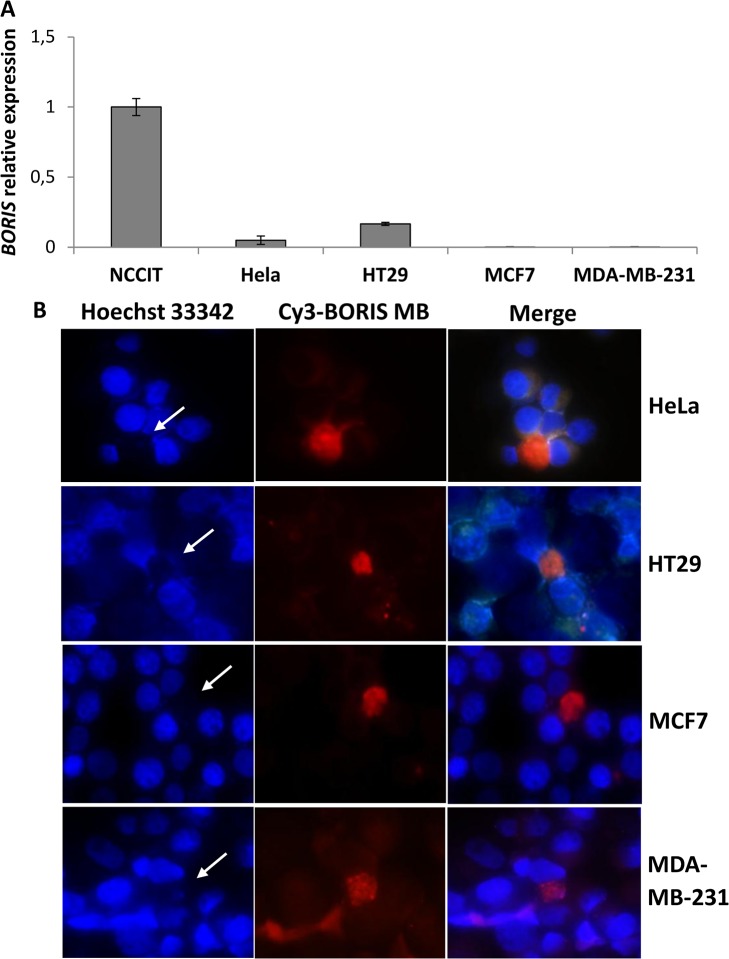
Fig 1. BORIS expression and SP analysis in human epithelial tumor cell lines.
(A) BORIS expression in human tumor cell lines. Total RNA from NCCIT (embryonic), HeLa (cervical), HT29 (colon), MCF7 (non-invasive breast) and MDA-MB-231 (invasive breast) tumor cells were extracted and BORIS expression was analyzed by qRT-PCR. The results were normalized to GAPDH and related to NCCIT cells. Error bars represent the mean ± SD (n = 3). (B) BORIS expression as detected using BORIS-MB. Representative images of HeLa, HT29, MCF7 and MB-MDA 231 cells, 40X magnification. Cells were incubated with Cy3-BORIS MB (200 nM) and Hoechst 33342 (5 μg/mL) at 37°C for 1.5 hour in serum-free medium and then examined under fluorescent microscopy. White arrows indicate Hoechst negative cells which are also BORIS mRNA positive as detected by BORIS-MB.

