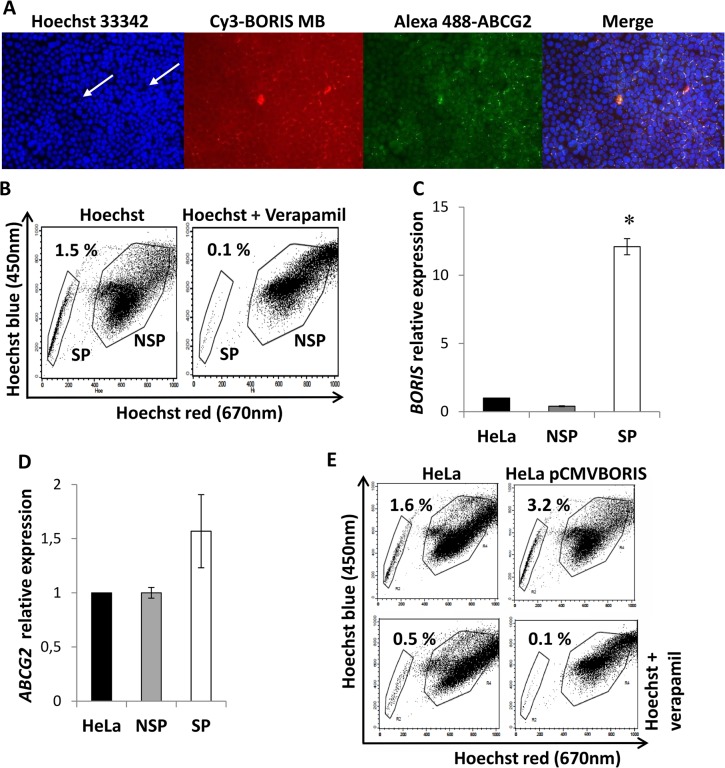
Fig 2. BORIS and ABCG2 expression in isolated SP HeLa cells.
(A) Immunofluorescence analysis of ABCG2 in HeLa cells. The cells were incubated with BORIS-MB and Hoechst 33342 at 37°C for 1.5 h in serum-free medium. After cytocentrifugation the slides were fixed with cold acetone and then incubated with rabbit polyclonal ABCG2 antibody. The BORIS positive/ABCG2 positive/Hoechst negative cells are indicated with white arrows. 10X magnification. (B) Representative dot plot of flow cytometry analysis of SP. HeLa cells were incubated with Hoechst 33342 (12.5 μg/mL) either alone or in combination with verapamil (50 μM). The analysis was performed using LSRII and the sorting using FACS Aria. The gates indicate the sorted SP and NSP cells. (C) BORIS mRNA and (D) ABCG2 mRNA expression in SP and NSP isolated from HeLa cells. Total RNA was extracted and analyzed by qRT-PCR. Graphs indicate the mRNA levels of BORIS and ABCG2 genes normalized to GAPDH and related to the parental HeLa cells. Data are represented as mean ± SD from 3 independent experiments. Asterisk indicates p<0.05. (E) SP analysis in BORIS overexpressed cells. HeLa cells were transiently transfected with a BORIS expression vector (HeLa pCMVBORIS). After 2 days, 1 x 10⁶ cells were incubated with Hoechst 33342 (12.5 μg/mL) either alone (top) or in combination (bottom) with 50 μM verapamil. The analysis was performed using LSRII flow cytometry and one representative experiment of 3 independent experiments is shown.

