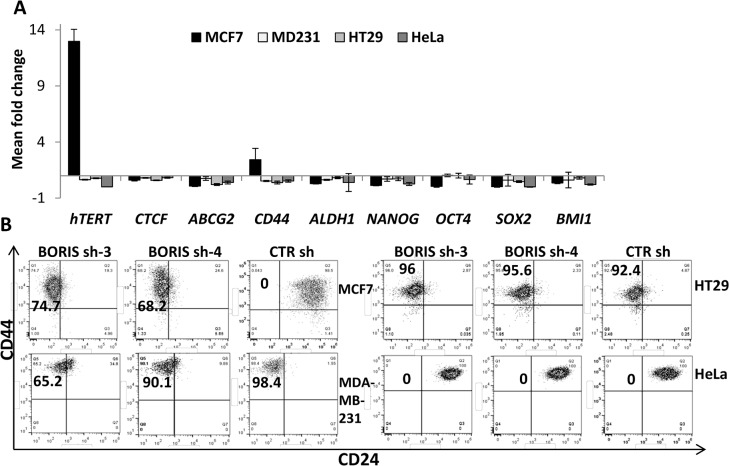
Fig 4. Impact of BORIS-knockdown on gene expression and CSC profile.
(A) MCF7, MDA-MB-231, HT29 and HeLa cells were engineered to stably exhibit knocked-down BORIS mRNA. BORIS sh-3, sh-4 and CTR sh (control shRNA containing scrambled sequence) lentiviruses were used to infect these cells. Each transduced cells were cultured with doxycycline to induce BORIS shRNA expression. Medium containing doxycycline was replaced every 3 days. After 2 weeks, RNA was isolated from BORIS sh-3, sh-4 and CTR sh of each transduced cell line. mRNA levels of the indicated genes were analyzed by qRT-PCR. Graphs represent for each gene the means of fold induction of both BORIS shRNA (BORIS sh-3 and sh-4) related to that of control of any cells. Standard errors were calculated considering error propagation of both BORIS shRNA analyses. Graphs show one representative experiment. (B) Representative flow cytometry dot plots of CD44 and CD24 expression in MCF7, MDA-MB-231, HT29 and HeLa cells engineered to stably exhibit knocked-down BORIS mRNA. CD44 and CD24 expression patterns of the two BORIS shRNA (BORIS sh-3 and sh-4) and the control (CTR sh) are shown. Anti-CD24 antibody labeled with AlexaFluor 647 and anti-CD44 antibody labeled with APC-H7 were used. The percentage of CD44+/CD24- population was estimated after gating on eGFP and tRFP positive cells (transduced and dox-induced shRNA, respectively) and the final gates are based on the isotype control corresponding to each cell line. All experiments were conducted independently three times and one representative experiment is shown for each group of cells.

