
Fig. 2.
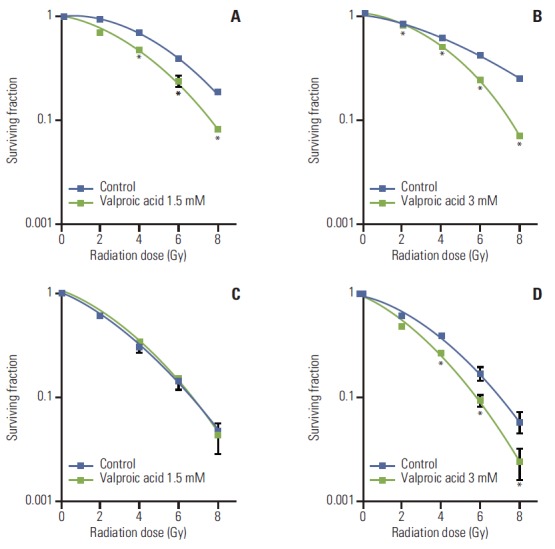
Survival curves of A549 and U87MG cells treated with valproic acid at various concentrations. (A) A549 cell treated with valproic acid at 1.5 mM. (B) A549 cell treated with valproic acid at 3.0 mM. (C) U87MG cell treated with valproic acid at 1.5 mM. (D) U87MG cell treated with valproic acid at 3.0 mM. Points, mean for three independent experiments; bars, standard error. *p < 0.05, versus control.