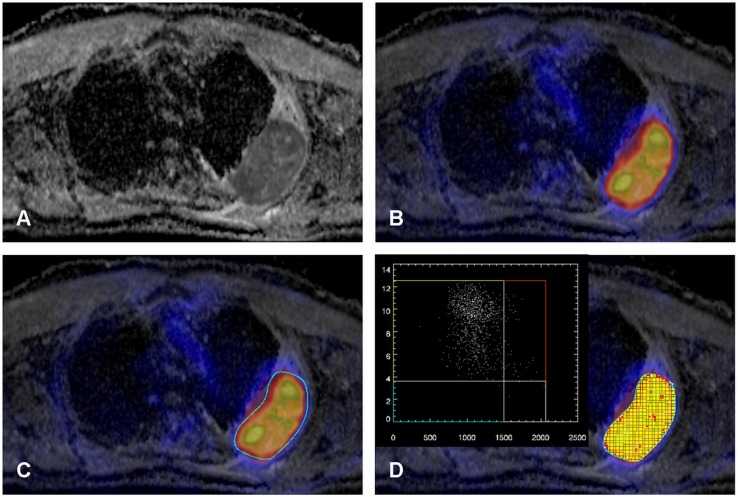
Fig 1. A-D. Patient with a primary NSCLC of the left upper lobe infiltrating the chest wall (A: ADC map from DW-MRI).
The tumor shows relatively homogenously low ADC values and high 18F-FDG uptake (B image fusion of 18F-FDG PET and the ADC map) with some focal spots. A ROI is placed around the tumor (C) and the Anima M3P software displays a scatter plot of the voxels within the ROI (D). Thresholds for low and high tracer uptake (y-axis) and low and high ADC values (x-axis) were defined (SUV = 3.6 for 18F-FDG and ADC 1.5 x10⁻³ mm²/s) and the localization of the voxels of each quadrant (yellow: SUVhigh/ADClow; red: SUVhigh/ADChigh; blue: SUVlow/ADClow; gray: SUVlow/ADChigh) can be displayed in the fusion image (D). Note, most tumor parts show intense glucose metabolism with restricted water diffusivity (yellow), however some spots of the tumor also show intense glucose metabolism despite less restricted water diffusivity (red).

