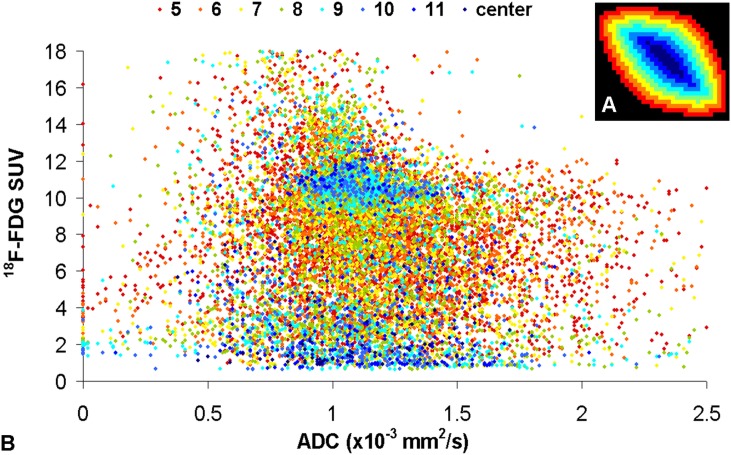
Fig 3. A-B. Scatter plot of the correlations of ADC and 18F-FDG uptake (B).
The colors from (A) denote the localization of the voxels (from red: periphery to blue: center). Voxels with high uptake of 18F-FDG and lower ADC values can be found in all tumor parts (B). Surprisingly, there is a substantial number of voxels with low uptake of 18F-FDG and lower ADC values, mainly located in the central areas, maybe due to high density of cells with low tumor activity or low density of tumor cells but dense tumor stroma caused by desmoplastic reactions (B). For higher ADC values >1.5 x10⁻³ mm²/s the 18F-FDG values are widely distributed (B).

