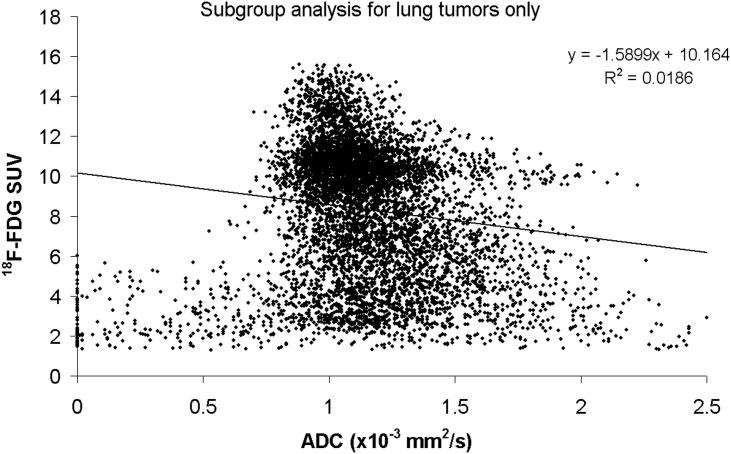
Fig 4. Subgroup analysis for the lung tumors only, showing a scatter plot of the voxel-by-voxel correlation of ADC and 18F-FDG uptake.
No correlation between the 18F-FDG uptake and ADC can be demonstrated. The distribution of the voxel data is comparable to Fig 3 and 75% of the voxels are located in the SUVhigh/ADClow cluster.

