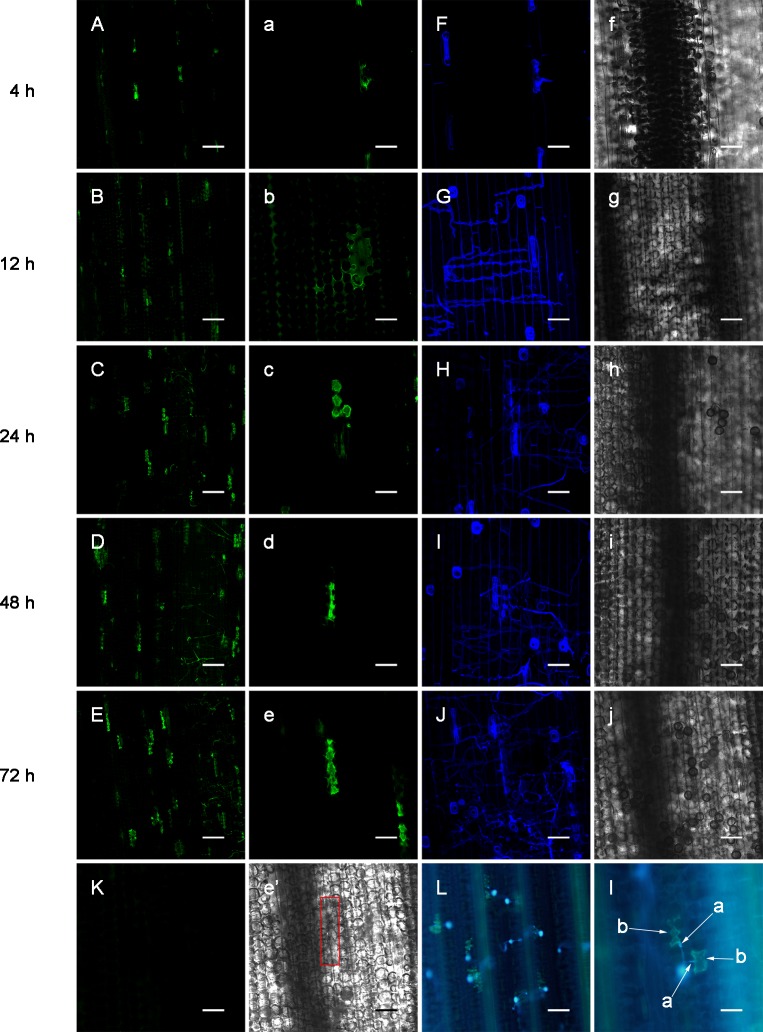
Fig 3. Changes of NO in L10 leaf after P. triticina infection.
NO distributions in L10 leaves at 4, 12, 24, 48, 72 h after inoculation with P. triticina race 260 (A)—(E). Enlargements of A—E (a)—(e). Observations of P. triticina on the surfaces of a—e (F)—(J). Transmitted light photographs of F—J (f)—(j). At 72 h after inoculation with P. triticina race 165 (K). Transmitted light photograph of e (e'). Observations of HR and P. triticina at 72 h after inoculation with P. triticina race 260 (L). Enlargement of L, with a- haustorium mother cell; b- HR cells (l). (A—E, K: Bar = 150 μm; a—e, F—J, f—j, e': Bar = 50 μm; L: Bar = 122.5 μm; l: Bar = 61.25 μm)

