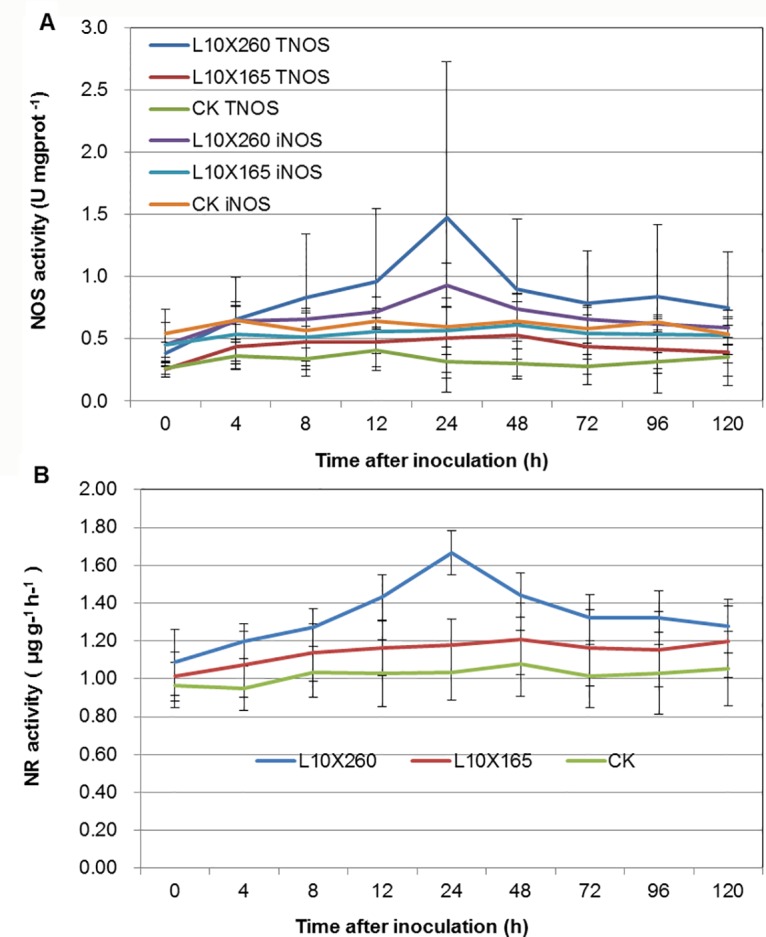
Fig 4. Changes of NOS and NR activities in different combinations.

NOS activity (A). Results were expressed as unit activity per milligram protein (U mgprot-1). NR activity (B). Each value was shown as mean ± SD (N = 3).

NOS activity (A). Results were expressed as unit activity per milligram protein (U mgprot-1). NR activity (B). Each value was shown as mean ± SD (N = 3).