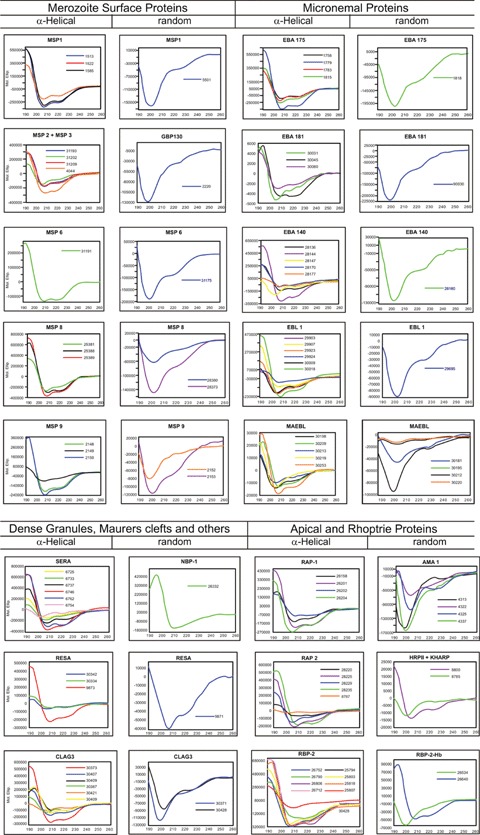
Fig 5.

Secondary structural features for HABPs corresponding to 25 proteins involved in invasion. The figure shows the CD spectra of 94 HABPs [95] where α-helical structural elements were present in some HABPs according to 208 and 220 nm minimal values and 190 nm maximum elipcity, whereas the other HABPs displayed random coil structures having 200 nm minima and maxima below zero elipcity.
