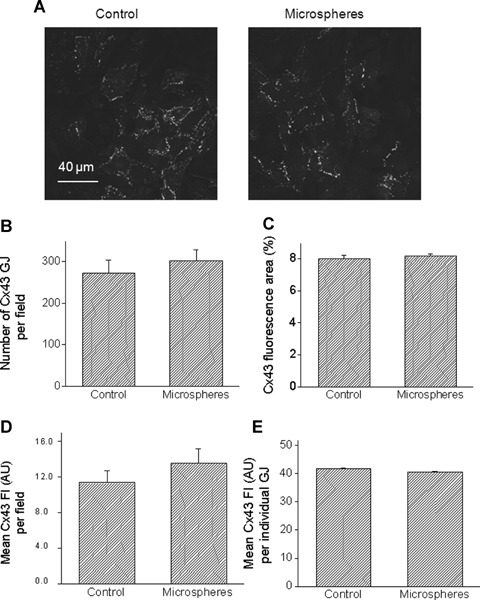
Fig 3.

Quantitative analysis of confocal microscopy images of cultures stained for Cx43. (A) Representative confocal images of a control culture (left), and a culture exposed for 24 hrs to microspheres (right). Scale bar = 40 μm. (B) Number of Cx43 gap junctions (GJ) per microscopic field. (C) Percent of microscopic field occupied by Cx43 positive signal. Mean fluorescence intensity (Fl) of Cx43 expressed as arbitrary units (AU) per microscopic field [D] or per each GJ [E]. Control, n = 8 fields; Microspheres, n = 10 fields.
