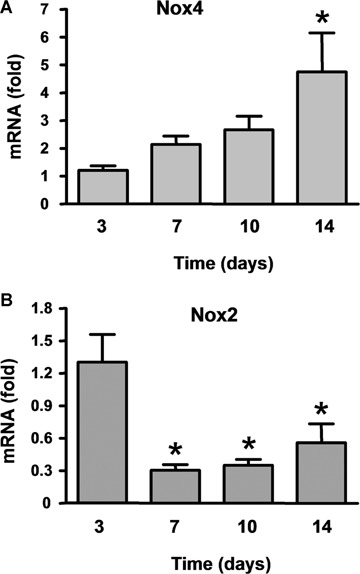
Fig 3.

Time course of the expression levels of mRNA of the NADPH oxidase Nox4 and Nox2 in the chamber tissue. Data (mean ± S.E.M.) are expressed as fold of the mean level of day 3. *P < 0.05 versus day 3, one-way analysis of the variance (anova) followed by Newman-Keuls t-test, n = 6–7.
