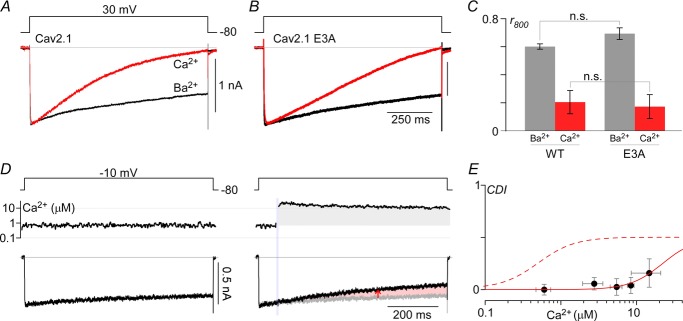
Figure 4. High Ca2+ requirements for CDI.

A, exemplar currents from CaV2.1 permeating either Ca2+ (red) or Ba2+ (black) during a 1 s depolarization to 30 mV. B, similar protocol for CaV2.1 E3A. In both cases, 40 Ca2+/40 Ba2+ (mm) were used to increase current density. C, population data for WT and E3A channels, plotting the ratio of currents at 800 ms to peak current for Ba2+ and Ca2+ (mean ± SEM). Both WT and E3A have n = 5 cells each, with comparison between E3A and WT done using unpaired Student's t test (P > 0.05). D, Li+ currents through CaV2.1 EFb E3A channels are stable at ∼0.7 μm (left). Uncaging Ca2+ to ∼14 μm elicits a small amount of CDI (right). E, compiling traces from n = 19 cells where Ca2+ was uncaged to various levels yields a Ca2+ dose–response curve for CDI (red continuous line), defined here as CDI = r400,before – r400,after (red arrow in D), where r400 = I(tuncaging)/I(tuncaging + 400ms). E, data points shown are mean ± STD, where fit is a Hill function with nHill = 2, IC50 = 22 μm. Fit for CDF's Ca2+ sensitivity is reproduced as red dashed line for comparison.
