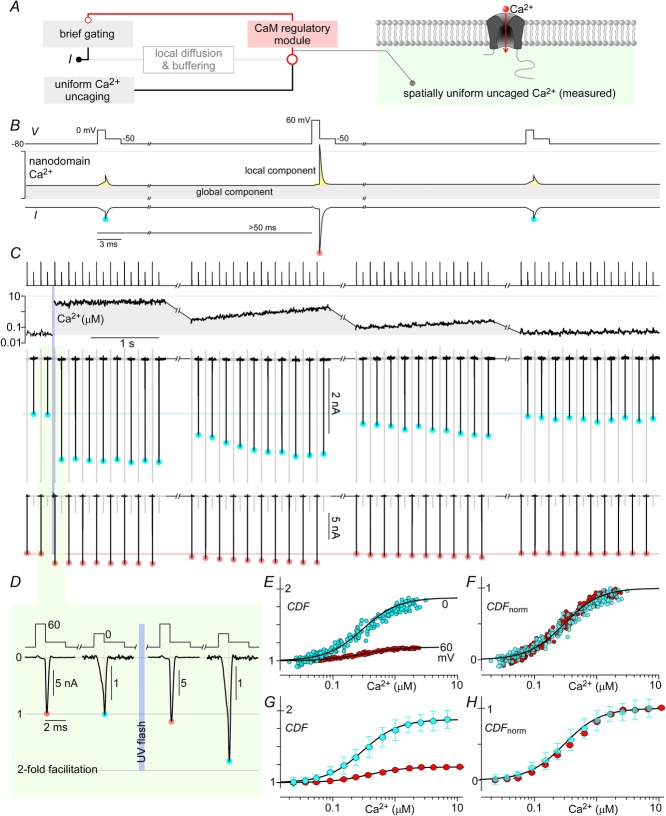
Figure 9. Towards resolving native CaV2.1 CDF.
A and B, schema outlining the strategy to resolve Ca2+ dependence of native CaV2.1 channels. A modified tail current protocol with very brief steps to 0 or 60 mV for 1 ms (brief gating) before eliciting tail currents at −50 mV minimizes the impact of local Ca2+ on the CaM regulatory module whilst still allowing assessment of the channel's state at two voltages. Uniform Ca2+ uncaging then provides an independent and measurable input to the regulatory module, pushing channels into the facilitated mode. C, exemplar traces from a single cell, illustrating Ca2+ tail currents evolving with time and global Ca2+. Voltage pulse protocol is displayed in the top row, and global Ca2+ in the second row. Tail currents triggered by preceding step to 0 mV are scaled up for clarity and shown in black in the third row (tails triggered by preceding 60 mV steps in grey), with cyan circles marking the peaks. The last row shows the tail currents triggered by preceding 60 mV steps in black, with peaks marked by red circles. D, expanded time frame views of tail currents before and after Ca2+ uncaging, normalized to peak levels at baseline Ca2+. E, steady-state CDF vs. Ca2+ curves at the two voltages assessed are obtained by plotting normalized peak tail currents against instantaneous Ca2+ levels. F, CDF vs. Ca2+ curves of the 2 voltages are normalized, showing the same Ca2+ sensitivity. G and H, population data (mean ± STD) show similar results, with n = 9 cells. Fitted curves have nHill = 1.5, EC50 = 0.3 μm.

