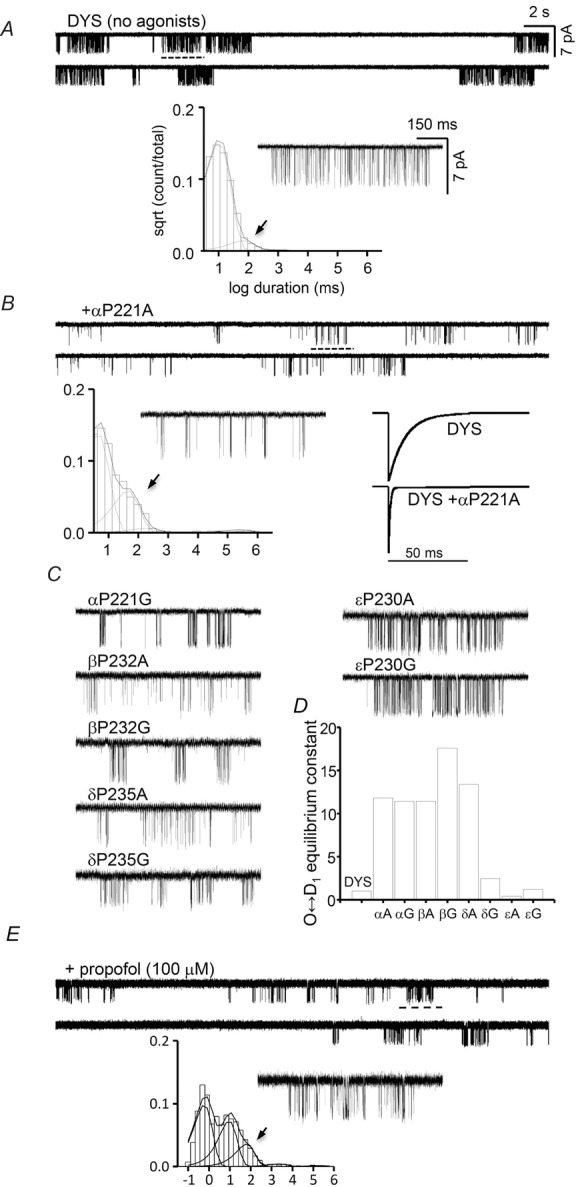
Figure 8. αP221 desensitization.

A, unliganded activity of the constitutively active background. Below, an example cluster and the global shut-interval duration histogram. The briefest component is gating and that with a time constant of τ ≈ 0.1 s (arrow) reflects sojourns in a brief desensitized state; longer desensitized components were infrequent and not visible in the histogram. B, unliganded activity of αP221A expressed on the same background. This mutation causes a substantial increase in the prevalence of the τ ≈ 0.1 s shut component. Bottom right, simulated whole-cell currents for a step increase to saturating [ACh] based on the rate constants shown in Table1. C, example clusters for other proline mutants. D, O↔D1 desensitization equilibrium constants (see Table1). A and G substitutions cause a ∼10-fold increase in this constant in the α and β subunits, as did A in δ. E, adding 100 μm propofol (same background, no proline mutation) causes a similar increase in the prevalence of the τ ≈ 0.1 s shut component.
